|
|
||
|
|
"The best way to predict the future is to invent it" --- Alan Kay , 1971, PARC (Palo Alto Research Center), invented computer program that was the inspiration for the windowing based systems used in the MacIntosh and and Windows operating system - click here for details on this quote. |
|
|
|
||
|
CBS 60 Minutes on Cold Fusion, April 2009: 12_Minute Video, Text Version, Pelley's Reporter's Notebook, Preview |
|||
|
Jeff Driscoll |
|
||
|
Cold Fusion is a new energy source that eventually will replace oil, coal, gasoline etc. It was headline news in 1989. The technology is still in the development phase and there are many technical papers showing that the effect is real. I am attempting to replicate experimental claims of groups that show positive results related to Cold Fusion. I'm looking for machinists, funding and technical help. My home laboratory is located in Boston, Massachusetts. ============================================================================= Blacklight Power (BLP) is a company that I think has figured out the puzzle of cold fusion. Though the technology is not fusion at all, it is chemical energy according to BLP. http://www.BlackLightpower.com/presentations/businesspresentation-web.pdf http://www.BlackLightpower.com (BlackLight Power website) I have created a website to compare the similarities of the Bohr Model of the atom and Randell Mills's model of the atom . It can be found here http://zhydrogen.com (Randell Mills is CEO of Blacklight Power) My business proposal is here: http://www.waterarc.com/h6.htm |
|||
|
My Current and Previous Work in Cold Fusion I've done many experiments over the years though without proof of the Cold Fusion effect. Lack of funding was a big impediment. I was limited in the number of experiments I could do and the number of iterations I could try. Funding is a big issue in this field. Materials and equipment are expensive and many hours are needed to do these experiments properly. Below is a partial listing of the experiments I've attempted. BlackLight Power: Potassium Hydride, Titanium Carbide Experiment Oriani: CR-39/Lithium Sulphate Experiment, Fall / Winter 2009 Arata: Palladium/Zirconium Experiment, 2009 High Voltage, High Frequency Experiment, 2008 Capacitive Discharge Experiment, 2007 Proton Conductor Experiment, 1995 Creating Ball Lightning using capacitive discharges, 2008 BlackLight Power:
BlackLight Power: Potassium Hydride, Titanium Carbide Experiment (on hold) I had originally planned to attempt to replicate an experiment done by BlackLight Power (based in New Jersey). But I put those plans on hold and decided to create a website comparing the Bohr Model of the atom and Randell Mills model of the atom: http://zhydrogen.com Below is a description of how I planned to originally do the experiment (though it is now on hold). BlackLight Power's experiment that I planned to replicate involves heating chemicals (Potassium Hydride) to approximately 600 C and measuring the thermal energy output and comparing it to the calculated maximum theoretical heat output using conventional chemistry. The experiment that I originally planned to replicate is from this paper from BlackLight Power: http://www.BlackLightpower.com/papers/Eng Power050410S.pdf BlackLight Power claims that the ratio of the heat output to the calculated (conventional chemistry) heat output is 2-6 in some of their experiments and infinity in other experiments. The ratio would be 1 or lower if the reactions had followed conventional chemistry. Any ratio above 1 indicates more energy out than conventional chemistry would allow. In the experiments where BlackLight Power lists an infinite ratio, there was no known conventional exothermic (heat releasing) reaction for the given chemicals but the experiment did produce excess heat. Note that in these ratio calculations, the energy to heat the chemicals to approximately 600 C is subtracted out because that heat energy is used to just "trigger" the reaction. I personally received recommendations from the CEO of BlackLight Power (Randell Mills) that the following four chemical combinations could be used (though in separate experiments):
(A) KH, Mg, TiC, AgCl where KH = Potassium Hydride, Mg = Magnesium, TiC = Titanium Carbide, LiCl = Lithium Chloride, MgF2 = Magnesium Flouride , EuBr2 = Europium Bromide, AgCl = Silver Chloride In a nutshell, BlackLight Power claims that in certain conditions, Hydrogen releases energy and becomes what they term a "Hydrino". Physical contact between the Hydrogen and specific catalyzing atoms (Potassium, Sodium etc) at high temperatures, such as 500 Celsius, will cause the electron of the Hydrogen atom to fall to a lower orbit and release energy. This lower orbit is lower than was previously thought possible (lower than the n=1 state as used in the Rydberg equation). In the Hydrogen atom, the electron orbits at integer values such as 1, 2, 3, 4, 5 etc. The first level ("1") is closer to the nucleus (the proton) than the second level ("2"). Higher values mean larger orbits and a higher energy level for the electron. Conventional physics says the electron can not orbit at levels lower than the first level ("1"). But BlackLight Power says in specific circumstances, the electron can fall to orbits lower than 1 such as 1/2 or 1/3 or 1/4 and release energy when it falls to the lower orbit. There is a famous equation that relates these orbit integer values (1, 2, 3, 4, 5 etc) to the wavelength of the light emitted when the electron falls to a lower orbit. The Rydberg equation is the following: 1 / λ = R (1 / nf2 - 1 / ni2) where λ is the wavelength of the emitted light and ni is the initial orbit level and nf is the final orbit level and R is the Rydberg constant. Conventional physics says that ni and nf can only be integers but BlackLight Power says that ni and nf can be fractional states such as n = 1/2, 1/3, 1/4 ....1/p (where p <= 137 and p is an integer). There are two versions of the BlackLight Power experiment that I plan to build, designated Experiment #1 and Experiment #2. Experiment #1 will be tried first. Experiment #1: Continuous Temperature Cycling at High Temperature Experiment #1 involves cycling between two temperatures and comparing the total energy put into the "Active" reaction vessel with the total energy put into the "Control" reaction vessel. The "Active" reaction vessel will contain the chemicals recommended by BlackLight Power (KH, Mg, TiC, AgCl) while the "Control" reaction vessel will contain Aluminum Oxide powder or some non-reacting chemical and a gas that doesn't react with Aluminum Oxide such as Nitrogen or Argon gas. If the energy into the "Control" reaction vessel is higher than the average power into the "Active" reaction vessel then that would be termed the "excess energy". If the excess energy is larger than could be explained by conventional chemistry then the experiment will be deemed a successful replication of the BlackLight Power process. Experiment #1 involves the following steps: 1. Put approximately 60 grams (total) of the following chemicals in the reaction vessel having a volume of 45 cc: Potassium Hydride (14 g), Titanium Carbide (32 g), Magnesium (8 g) and Silver Chloride (6 g). 2. Evacuate with vacuum pump and then fill with 5 psi of Hydrogen gas (this pressure may change as information is gathered on the design of this experiment) 3. Wrap the reaction vessel with thick ceramic wool insulation so that it is covered with 6" thick insulation. 4. Heat to approximately 550 C with a band heater on the outside surface of the reaction vessel while monitoring the amount of energy input into the band heater. Two thermocouples will be on the outside surface of the band heater. The actual maximum temperature that it will be raised to will be determined later since this temperature needs to be optimized. Temperature measurements will be done with two thermocouples on the outside surface of the band heater. 5. Turn off heater until the reaction vessel reaches approximately 450 C. The actual lower temperature that it will be allowed to cool to will be determined later since this temperature needs to be optimized. 6. Continue to cycle between the upper temperature (550 C) and the lower temperature (450 C) for 50 to 100 cycles where one cycle equals 450 C up to 550 C and then back to 450 C. *****Update***** I have recently learned that the Potassium will react with the Chlorine (using example "A" in the list given above) atom to make Potassium Chloride (KCl). The Potassium will need to be regenerated back to Potassium Hydride (KH) for the next thermal cycle. This is a problem that I need to address in my experiment. I plan to find out the best solution by asking Blacklight Power. Only a small fraction of the Hydrogen is converted to hydrinos on each thermal cycle - probably less than 0.5% assuming a cycle is similar to the thermal experiments that Blacklight Power run. I have decided to change the experiment and now I am setting up this: http://zhydrogen.com/?page_id=620 7. Create a "Control" reaction vessel which will be used as the null experiment. Make it identical to the "Active" reaction vessel except only add 60 grams of Aluminum Oxide powder and fill it with Nitrogen or Argon gas. This reaction vessel is filled with chemicals that will not make any excess heat so that it can be compared to the "Active" reaction vessel. Feed enough electrical power into the band heater of this "Control" reaction vessel to heat it to 550 C and cycle the power so that the temperature profile matches that of the "Active" reaction vessel. Compare the electrical energy into the "Active" reaction vessel with the "Control" reaction vessel over multiple temperature cycles such as 50 cycles. The difference in energy between the two systems (Active and Control) is termed the net energy. The net energy can be compared to the calculated maximum theoretical chemical energy that could possibly be released by the chemicals in the "Active" reaction vessel (such as Hydrogen reacting with Carbon and releasing energy). The excess energy is the difference between the net energy and the calculated maximum theoretical energy from conventional chemistry. Presumably the excess energy is due to the hydrino reaction chemistry occurring in the vessel. The goal of this experiment is to get a large fraction of the Potassium to evaporate and condense on each temperature cycle (450 C to 550 C). Additionally, as the Potassium condenses, the gaseous Hydrogen needs to react with the Potassium to form Potassium Hydride. BlackLight Power claims the Hydrino (and therefore excess energy) is formed when Potassium and Hydrogen are in physical contact with each other at a high temperature (such as 550 C). When the Hydrino is formed, the Potassium ionizes to a positive ion. The Potassium (positive ion) may become a gas (I assume) and eventually condenses in a cooler area of the reaction vessel. By letting the reaction vessel cool down to approximately 450 C, the Potassium ions will condense and some Hydrogen will naturally be absorbed and thus produce Potassium Hydride. The next thermal cycle will then heat this solid or liquid phase Potassium Hydride to a higher temperature and presumably produce more Hydrinos and excess energy. Eventually all (or a large fraction) of the Hydrogen will be converted to Hydrinos and the vessel would need to be replenished with fresh Hydrogen.
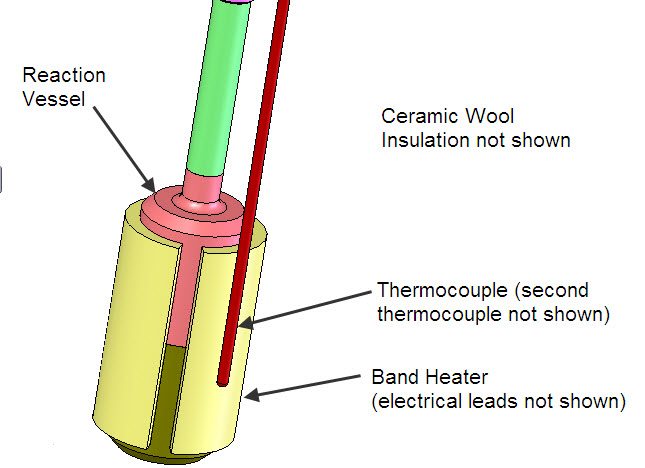
Figure above shows Reaction Vessel (45 cc), Band Heater and one Thermocouple (second thermocouple not shown) for Experiment #1.
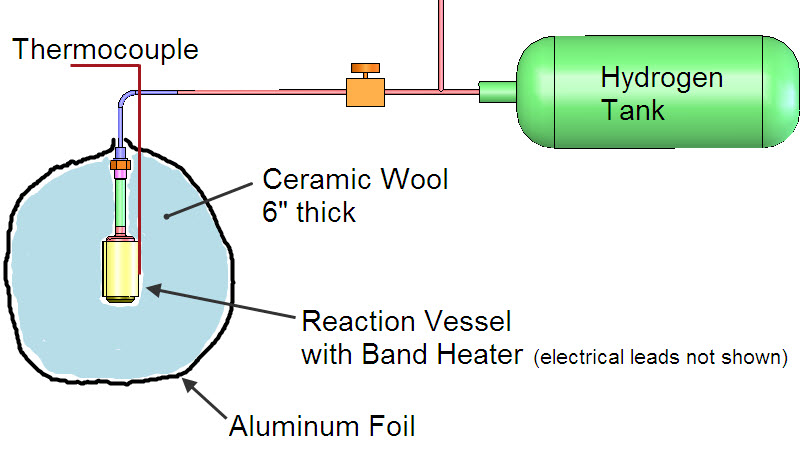
Figure above shows Reaction Vessel (45 cc) surrounded by 6" of ceramic wool insulation for Experiment #1. Vacuum Pump, valves and pressure relief valves not shown.
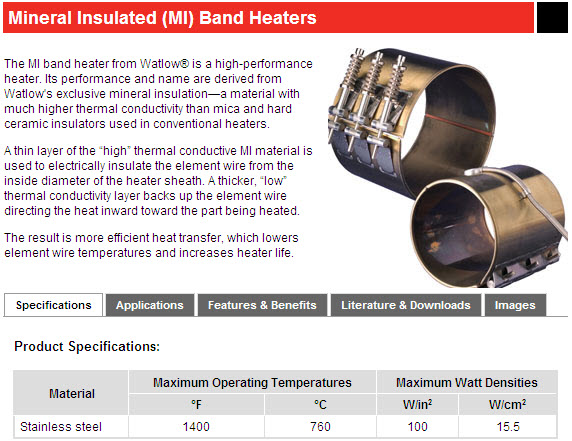
Picture above shows a band heater from Watlow Company.
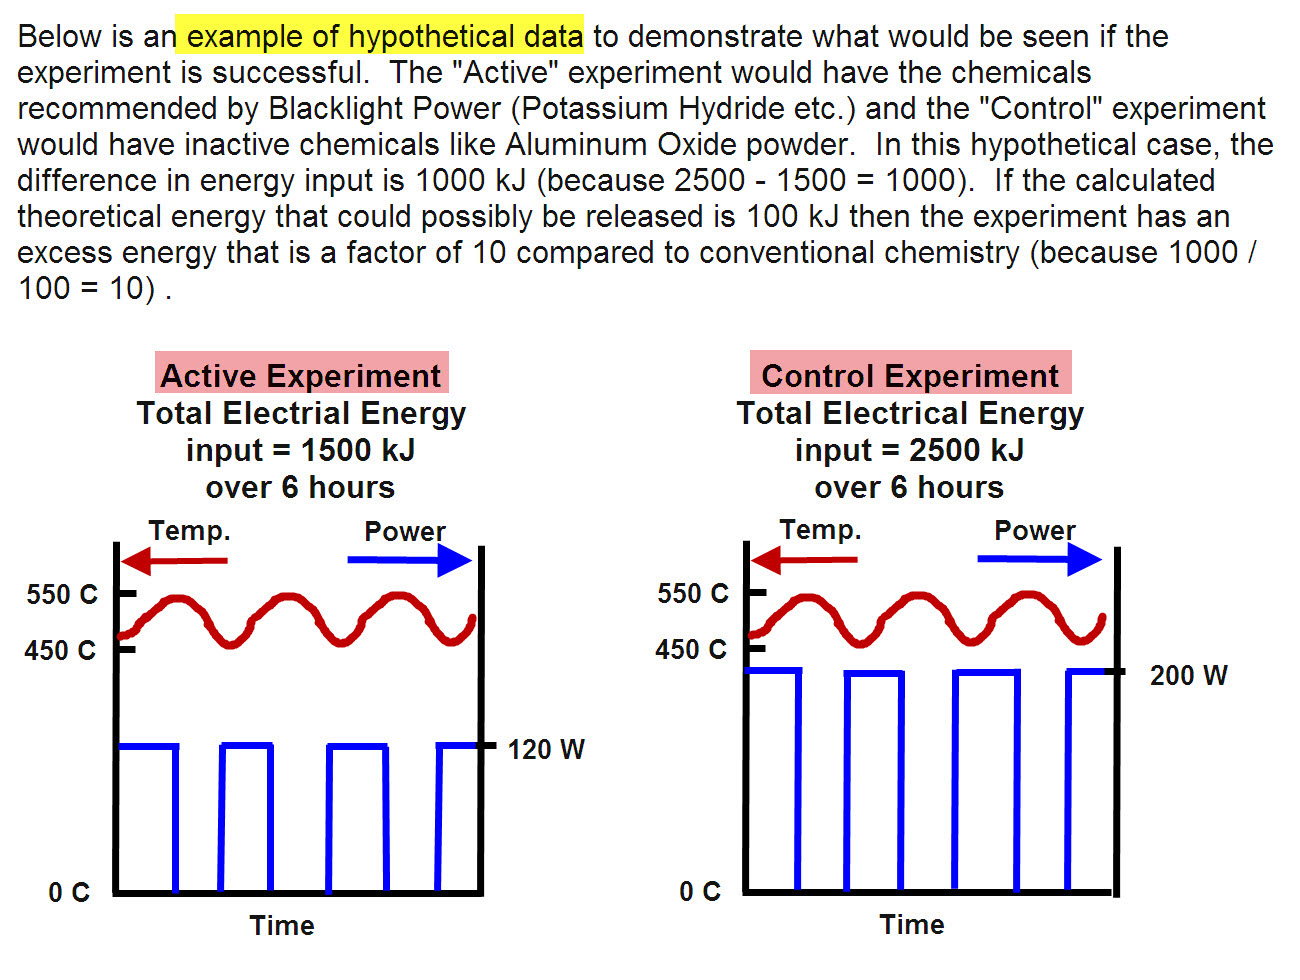
Picture above shows what the data will look like in a successful experiment. Click here for the proposed Experiment #2: Water Bath Calorimetry and the BlackLight Power Process.
|
|||
|
http://www.BlackLightpower.com/papers/Eng Power050410S.pdf (example based on this paper) Conventional chemistry predicts that the most heat that can be produced from a mixture of X grams of Potassium Hydride, Y grams of Titanium Carbide and Z grams of Magnesium is 1 kJ (for example): 4 kJ (for example) of heat are needed to heat the vessel and the chemicals from room temperature to 600 C and start the Hydrino reaction (the vessel is inside a calorimeter). The vessel and its chemicals are cooled to room temperature and during this time the calorimeter is monitoring the total heat emitted by the vessel. The calorimeter detects 7 kJ of heat energy (this includes the 4 kJ to heat the chemicals to 600 C) Therefore 7kJ - 4 kJ = 3 kJ of energy were produced from the chemical reaction (termed Enet in the paper). This compares to the 1 kJ of maximum calculated theoretical energy released based on conventional chemistry (termed Emt in the paper). Therefore the ratio of heat output to theoretical heat output is 3/1 = 3 (termed G for gain in the paper). In this case, 2 kJ of "Hydrino" energy (because 3 - 1 = 2) were produced (termed Eex in the paper). In this hypothetical example, this ratio of G = 3 would be in the right most column of Table 3 (under G for energy gain) starting on page 48 of the paper having the link shown above.
|
|||
|
The BlackLight Power process is a catalyzing process where Hydrogen is continuously fed into the reaction chamber and excess heat is continuously produced with the chemicals (Potassium, Titanium etc) used over and over to create Hydrinos. Temperature cycling between two temperatures such as from 450 C up to 600 C and then back to 450 C is needed so that the Potassium condenses and then evaporates on each cycle. So, theoretically each Potassium atom could produce billions or trillions of Hydrinos after enough time has passed without ever being consumed in the reaction (the Potassium acts as a catalyst). There is 200 times more heat output per hydrino reaction compared to energy needed to make a Hydrogen atom from water (same energy as when Hydrogen is burned with Oxygen). According to BlackLight Power, a Hydrino is a Hydrogen atom with an electron that has fallen to fractional orbit level such as n = 1/2 or n = 1/3, 1/4 etc. ============================================================================== BlackLight Power, based in New Jersey, has discovered a way to extract energy from Hydrogen in a way that has never been discovered before and have spent 60 million dollars over the past 19 years perfecting the process. BlackLight Power claims that they could use their process in a power plant for generating electricity that will cost no more than a typical power plant of today but that will have fuel costs that are a small fraction of a coal or oil fired power plant. Similarly, they claim that their process could be used to make a home heater that has little or no fuel costs. The only input is a limited amount of Hydrogen (which can be generated by the excess energy) because they say they that their process can extract 200 times more energy from each Hydrogen atom than could be obtained by just burning it in oxygen. They claim that a power plant based on their process would have a cost of fuel that is less than 1/10 of a penny per kWh compared to coal plants and natural gas power plants which have a cost of fuel of 3.3 and 6 cents per kWh respectively. They claim that the installed cost of a power plant based on the BlackLight Power process would be $1000 per kilowatt which is about the same as a natural gas turbine power plant (combined cycle type) and is half that of a coal power plant. BlackLight Power claims that under certain conditions, Hydrogen releases energy and becomes what they term a "Hydrino". Specifically that physical contact between the Hydrogen and certain catalyzing atoms (Potassium, Sodium etc) at high temperatures (approximately 600 C) will cause the electron of the Hydrogen atom to fall to a lower orbit that is lower than has been previously seen in conventional physics.
|
|||
|
Oriani: CR-39, Lithium Sulphate Experiment, Fall - Winter 2009 An attempt was made to reproduce a paper published by Richard Oriani in 2008. Oriani is a retired professor from University of Minnesota. He has a Ph.D. in Physical Chemistry from Princeton and for many years was the director of a large anti-corrosion institute at the University of Minnesota. He has been active in the Cold Fusion field since the beginning in 1989. Oriani's paper: http://www.lenr-canr.org/acrobat/OrianiRAreproducib.pdf There are a few people trying to reproduce Oriani's work as part of the "Curie Project". Oriani's work was inspired by a group at SPAWAR (U.S. Space and Naval Warfare Systems Center) SPAWAR's paper: http://www.lenr-canr.org/acrobat/MosierBosscharacteri.pdf ===================================================== Richard Oriani's Abstract from 2008 paper: Past work in this laboratory has shown that nuclear particles
generated during particles so that total reproducibility was not achieved. Therefore
another ========================================================== Below are photos of my setup:
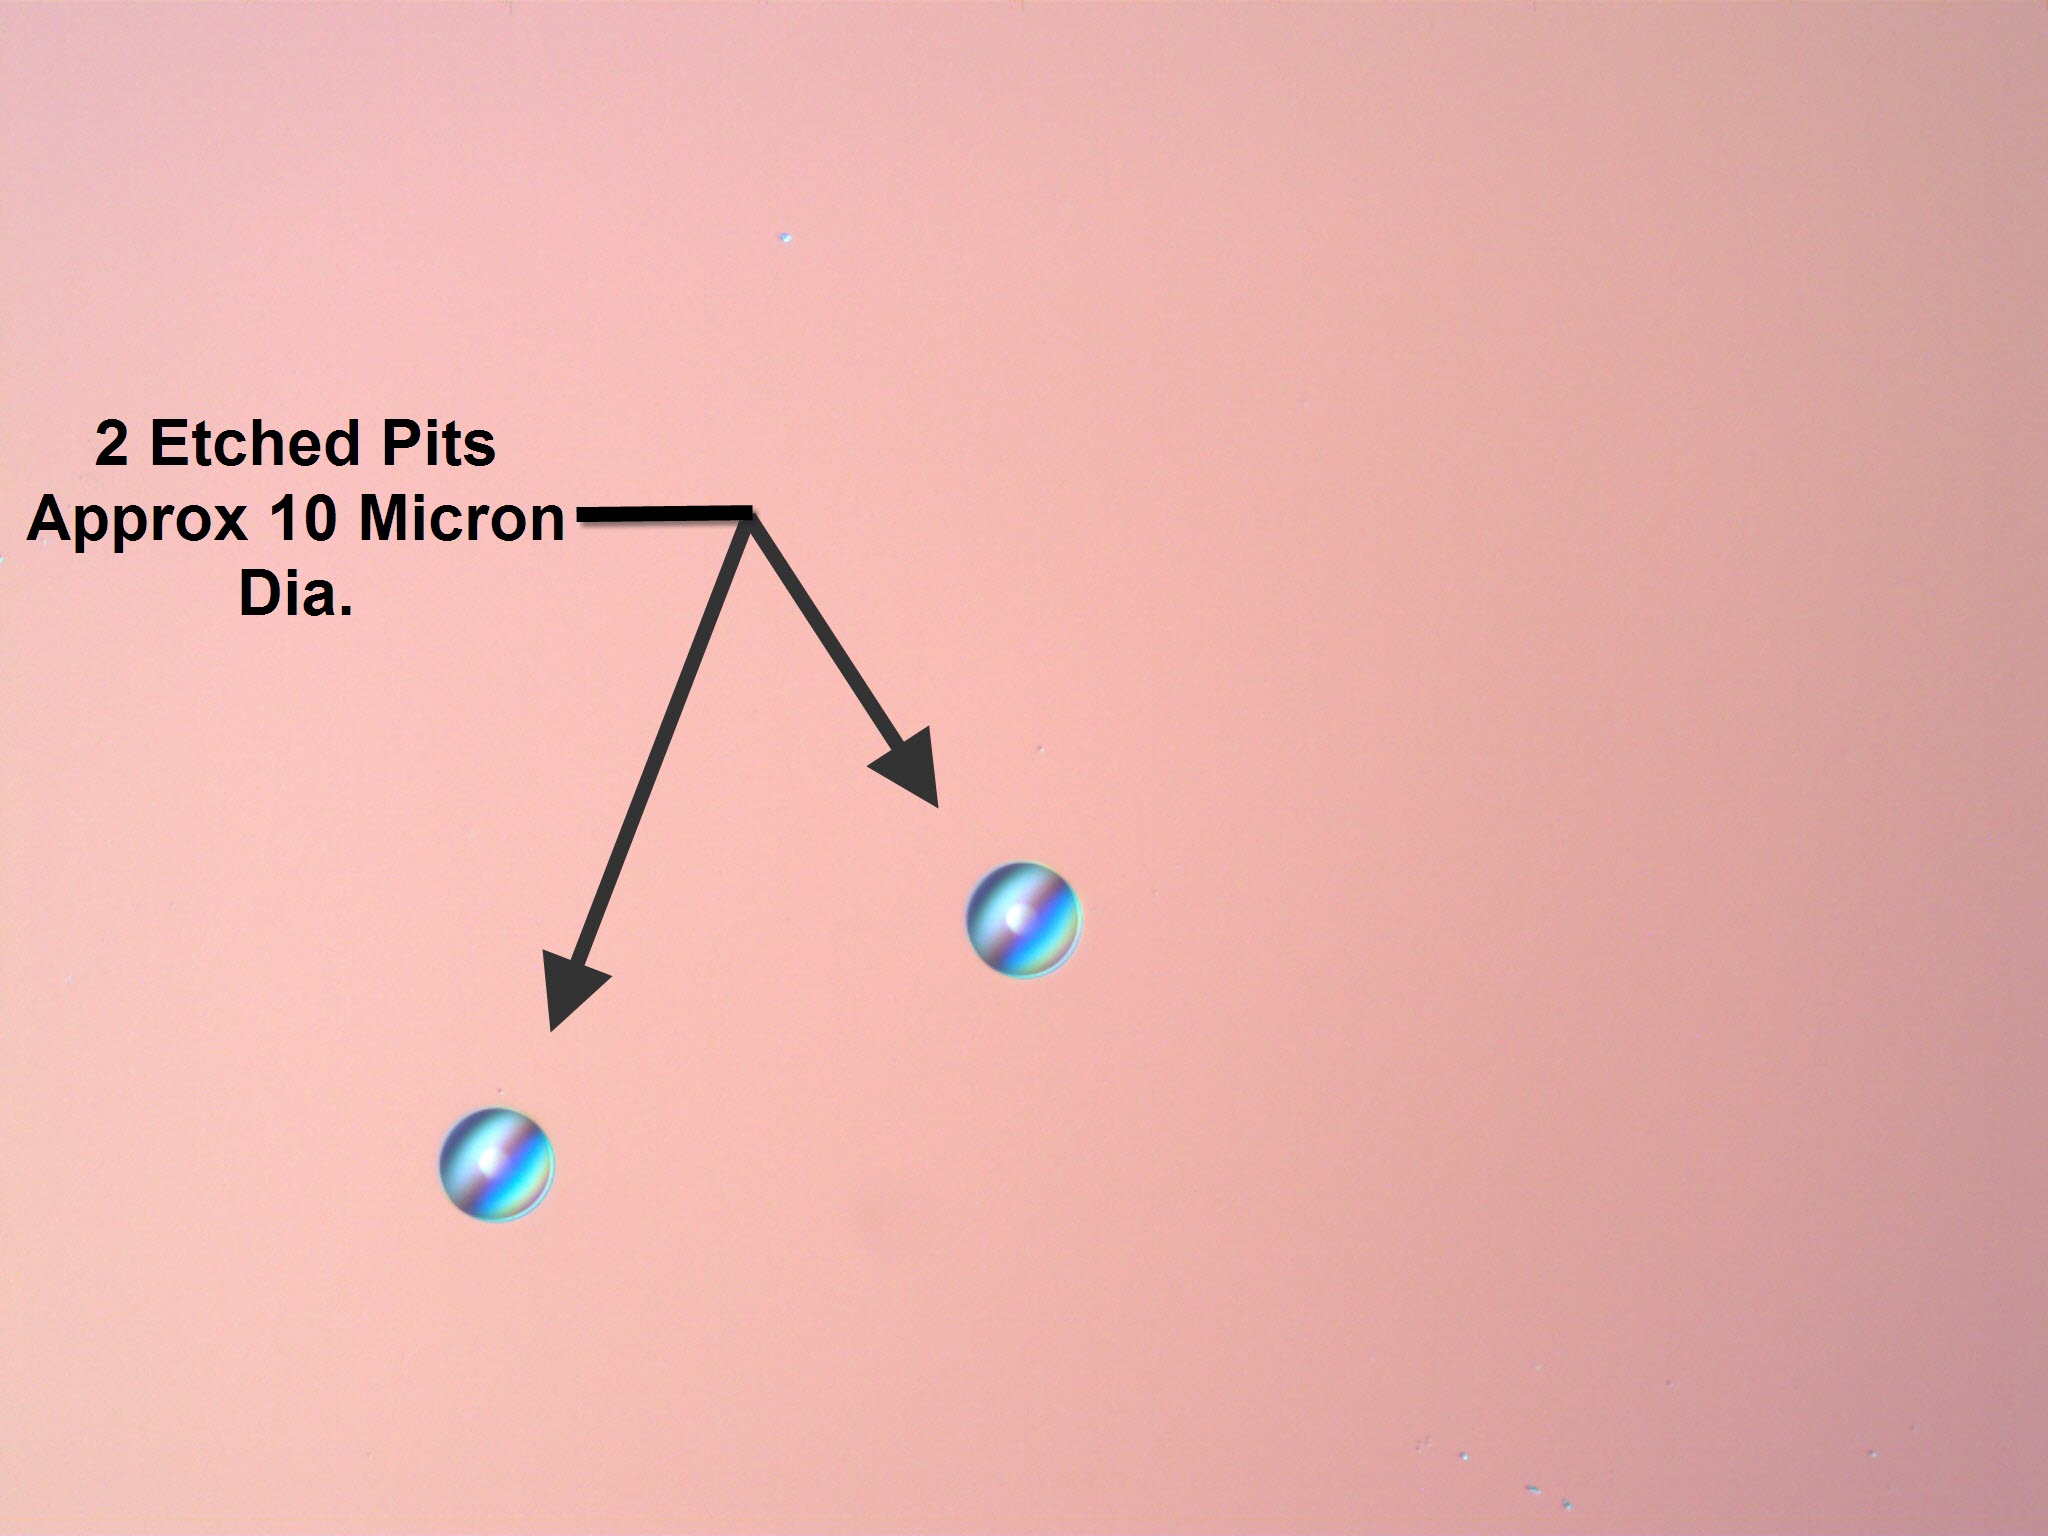
Below are microscope photos of the pits in the CR-39 that are approximately 10 microns (.0004") in diameter. CR-39 is a transparent polycarbonate (similar to Lexan) that acts as a detector of nuclear particles that travel through it. See http://en.wikipedia.org/wiki/CR-39 The photo on the left shows a pit that is somewhat oblong - as if the particle that did the damage had an incident angle that was not close to 90 degrees. The photo on the right shows two circular pits. The pits have a blue color and somewhat of an iridescent pattern as a result of their conical shape. The white dot in the center of the pit is the tip of the cone shaped pit. The axis of the cone has a direction of "into the page" because the nuclear particle traveled roughly perpendicular through the surface. The "line" damage that occurs is etched and results in a cone shape. This is because the caustic NaOH etches the damaged plastic near the CR-39 surface much longer than the damaged plastic that is, for example, 15 microns deep into the plastic. A cone shaped pit can be 10 microns wide near the surface and has a depth that appears to be roughly 30 - 60 microns (as is seen in photos in the literature).
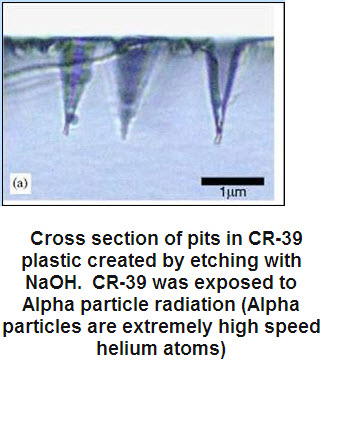
===================================================== Below is a photo that I found on the internet that shows the cone shaped cross section of the pits that were created by exposing CR-39 to alpha particles and etching with Sodium Hydroxide (NaOH).
Results We were unable to reproduce the results of Oriani's experiment. The link to our paper will eventually be published in Volume 4 of the JCMNS publication (Journal of Condensed Matter Nuclear Science): http://www.iscmns.org/CMNS/publications.htm
|
|||
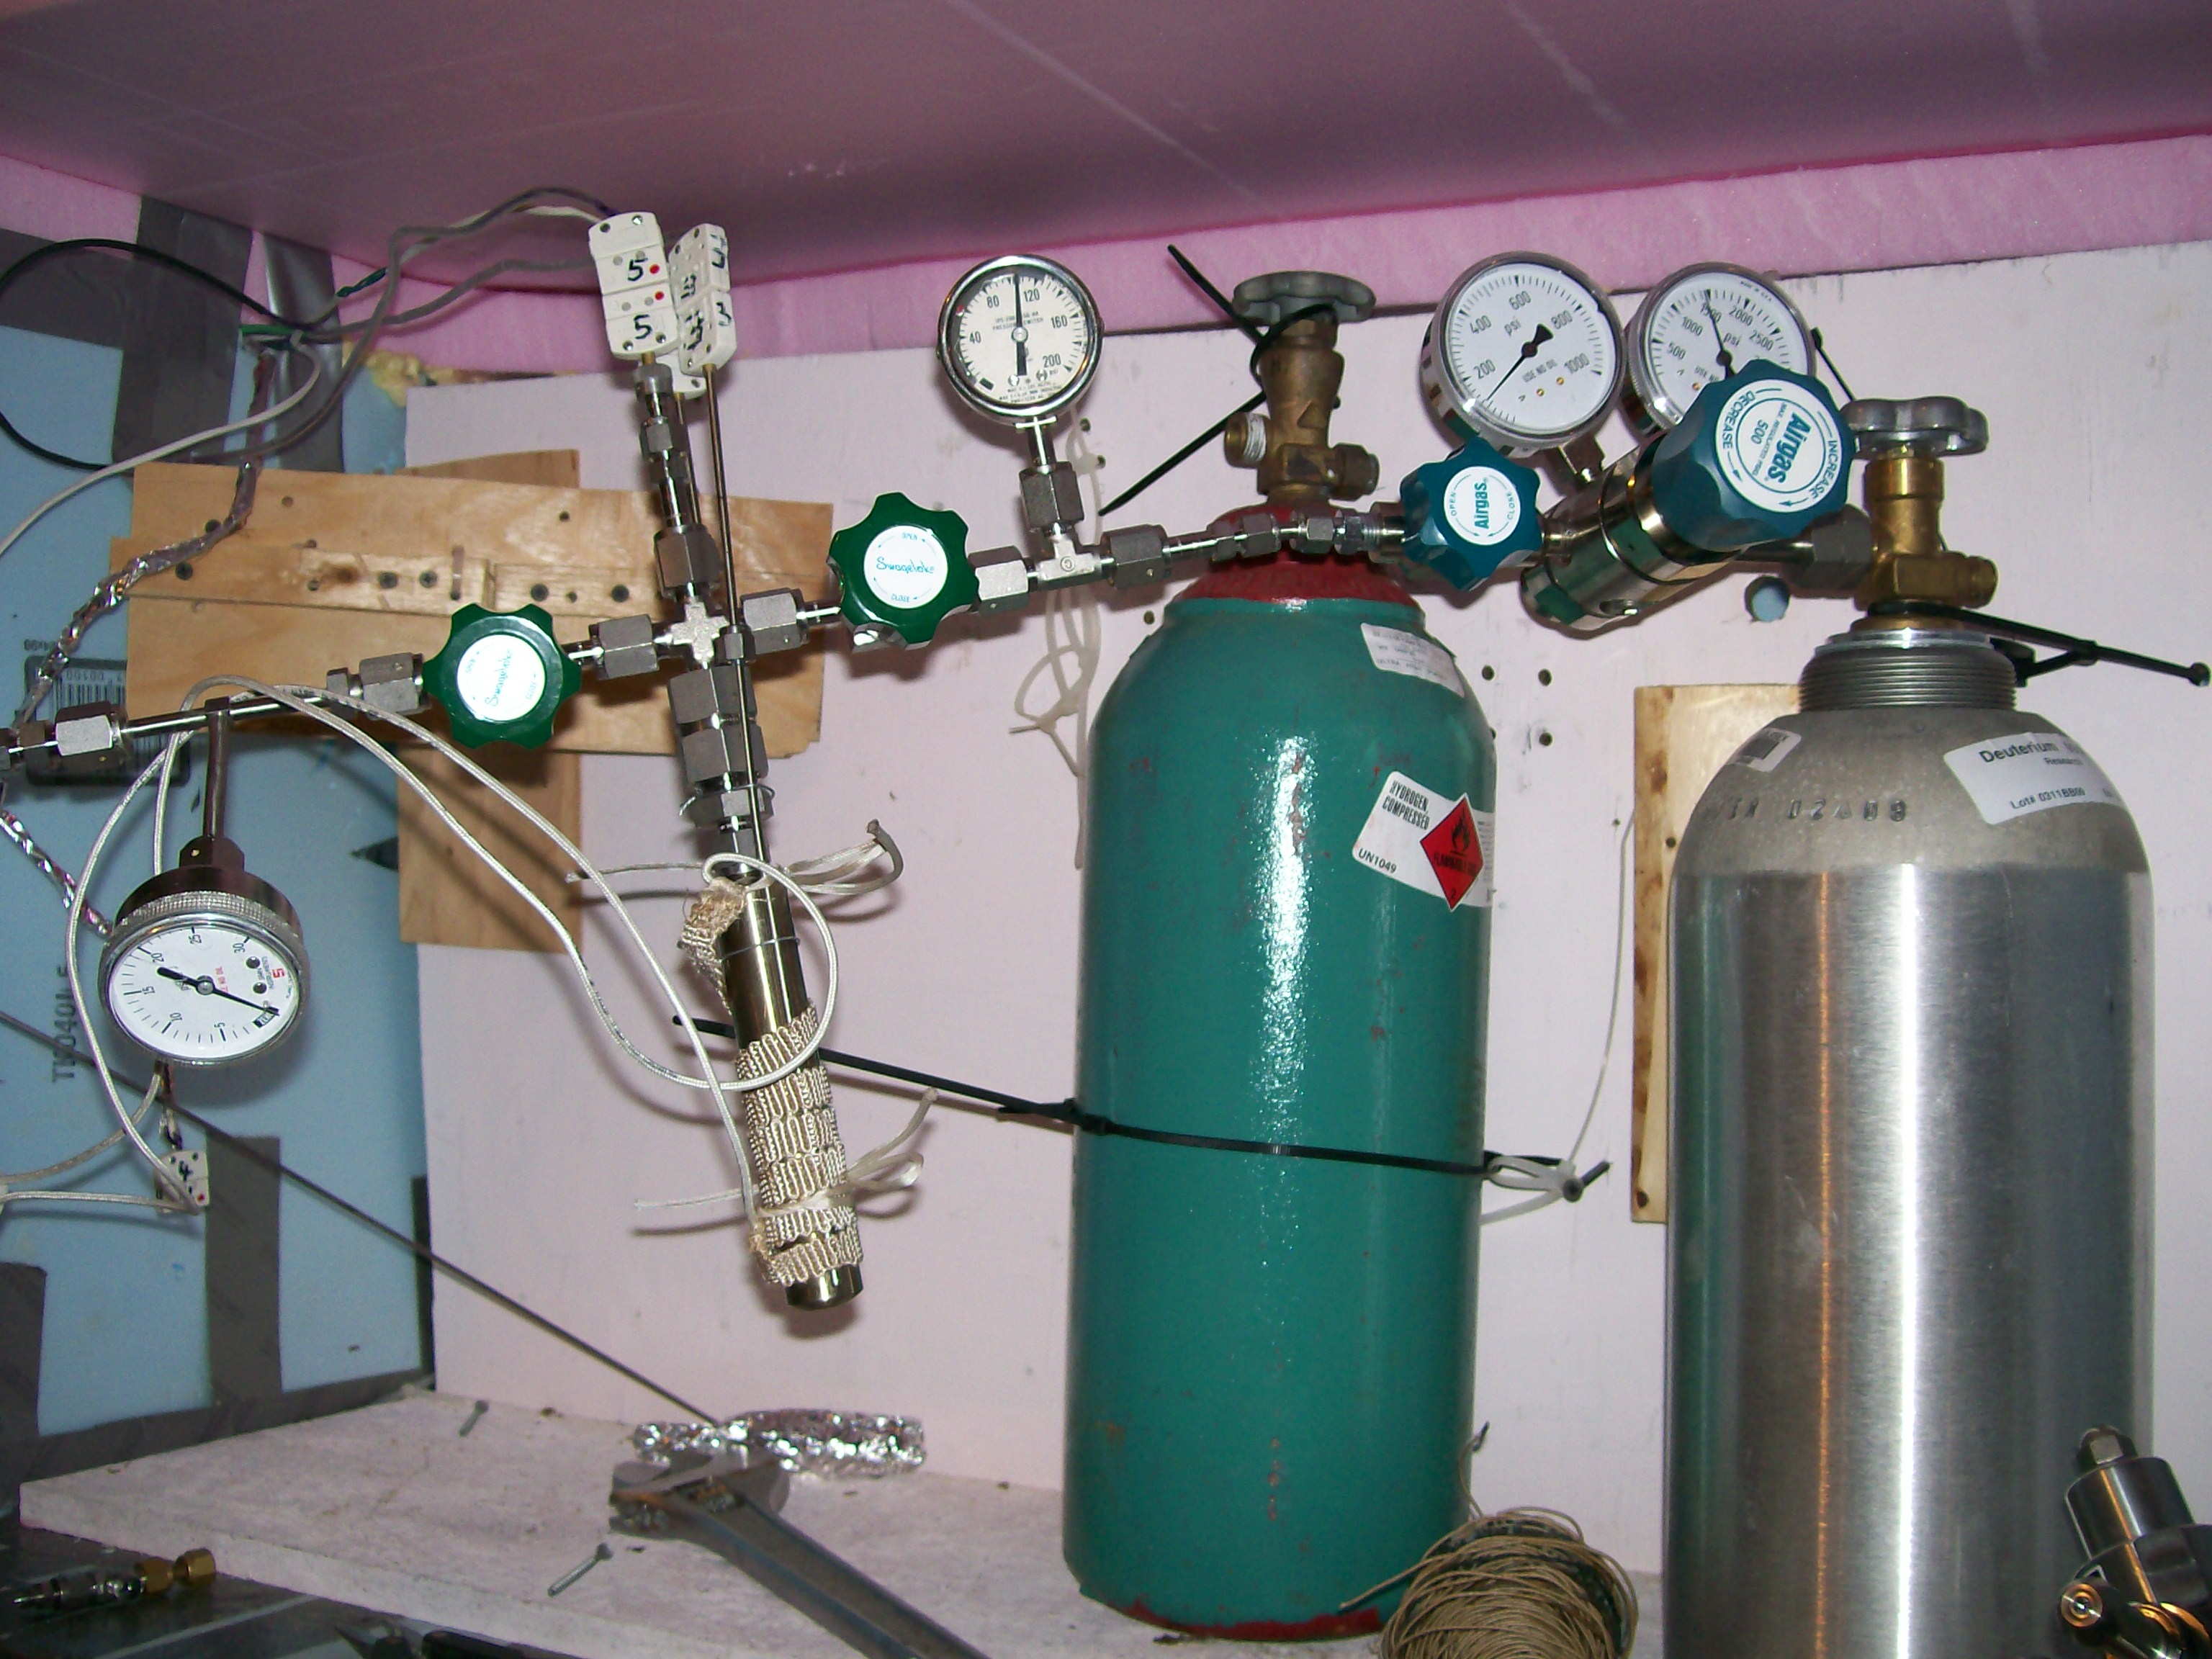
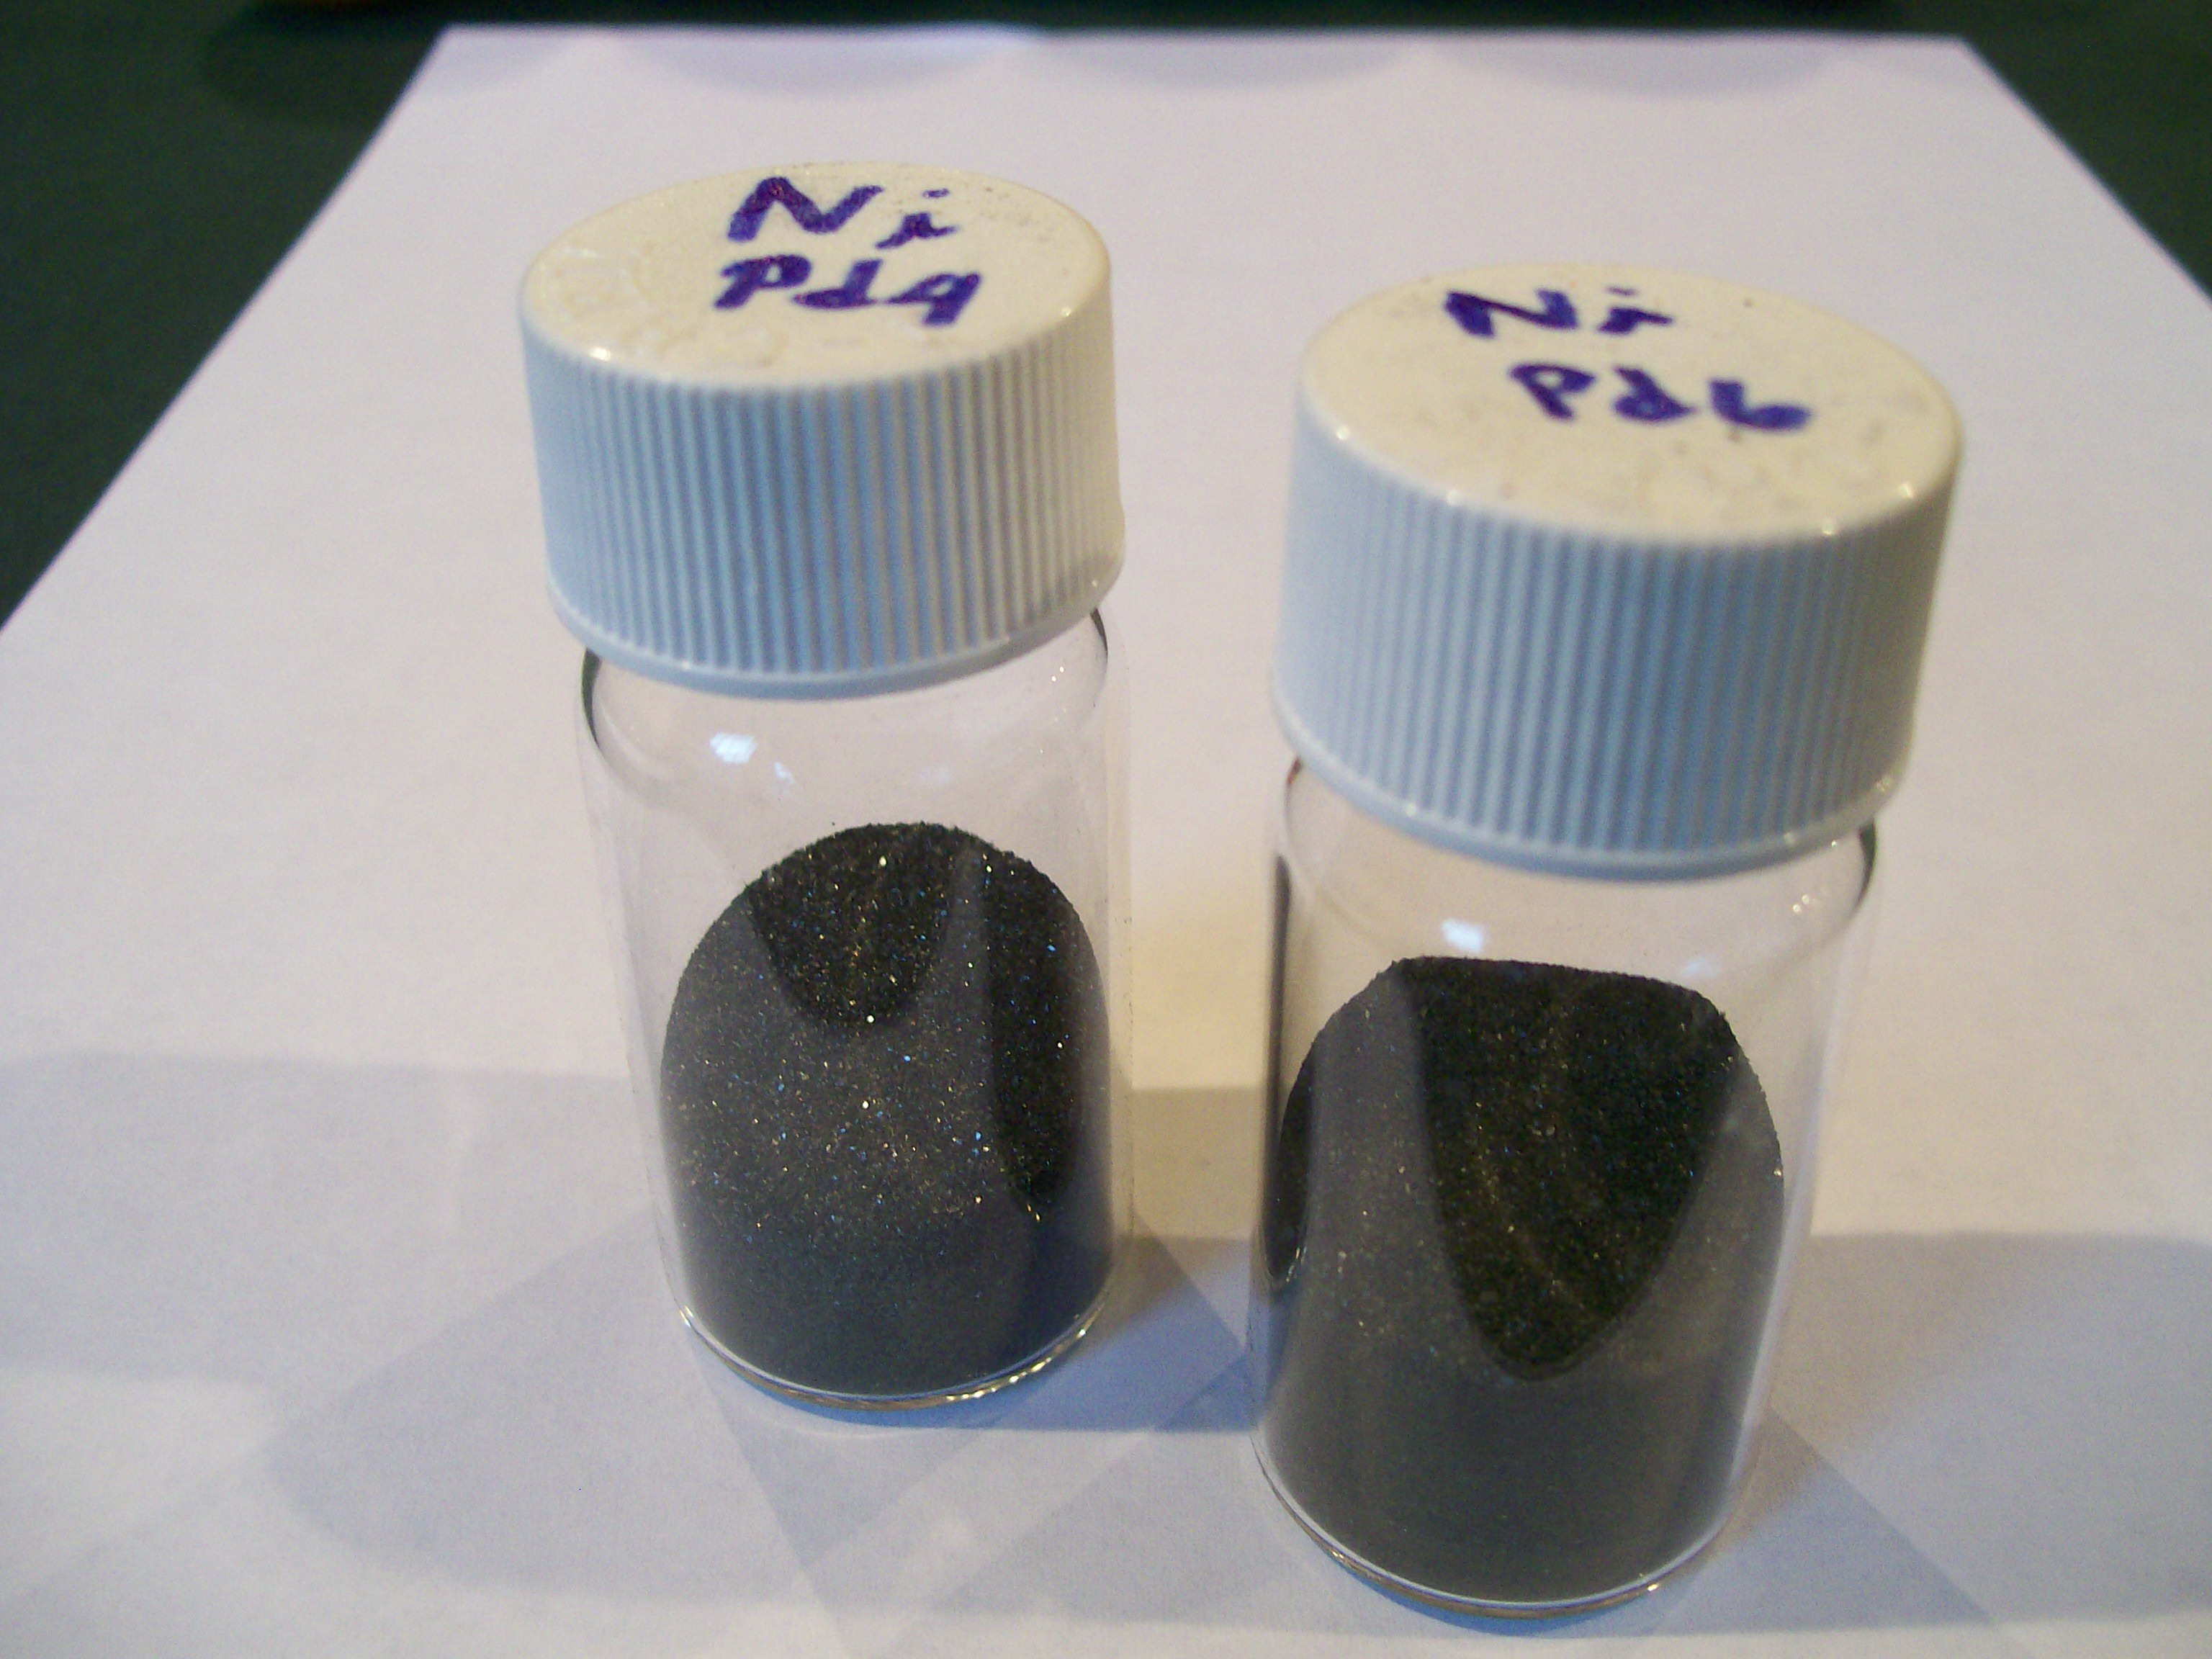
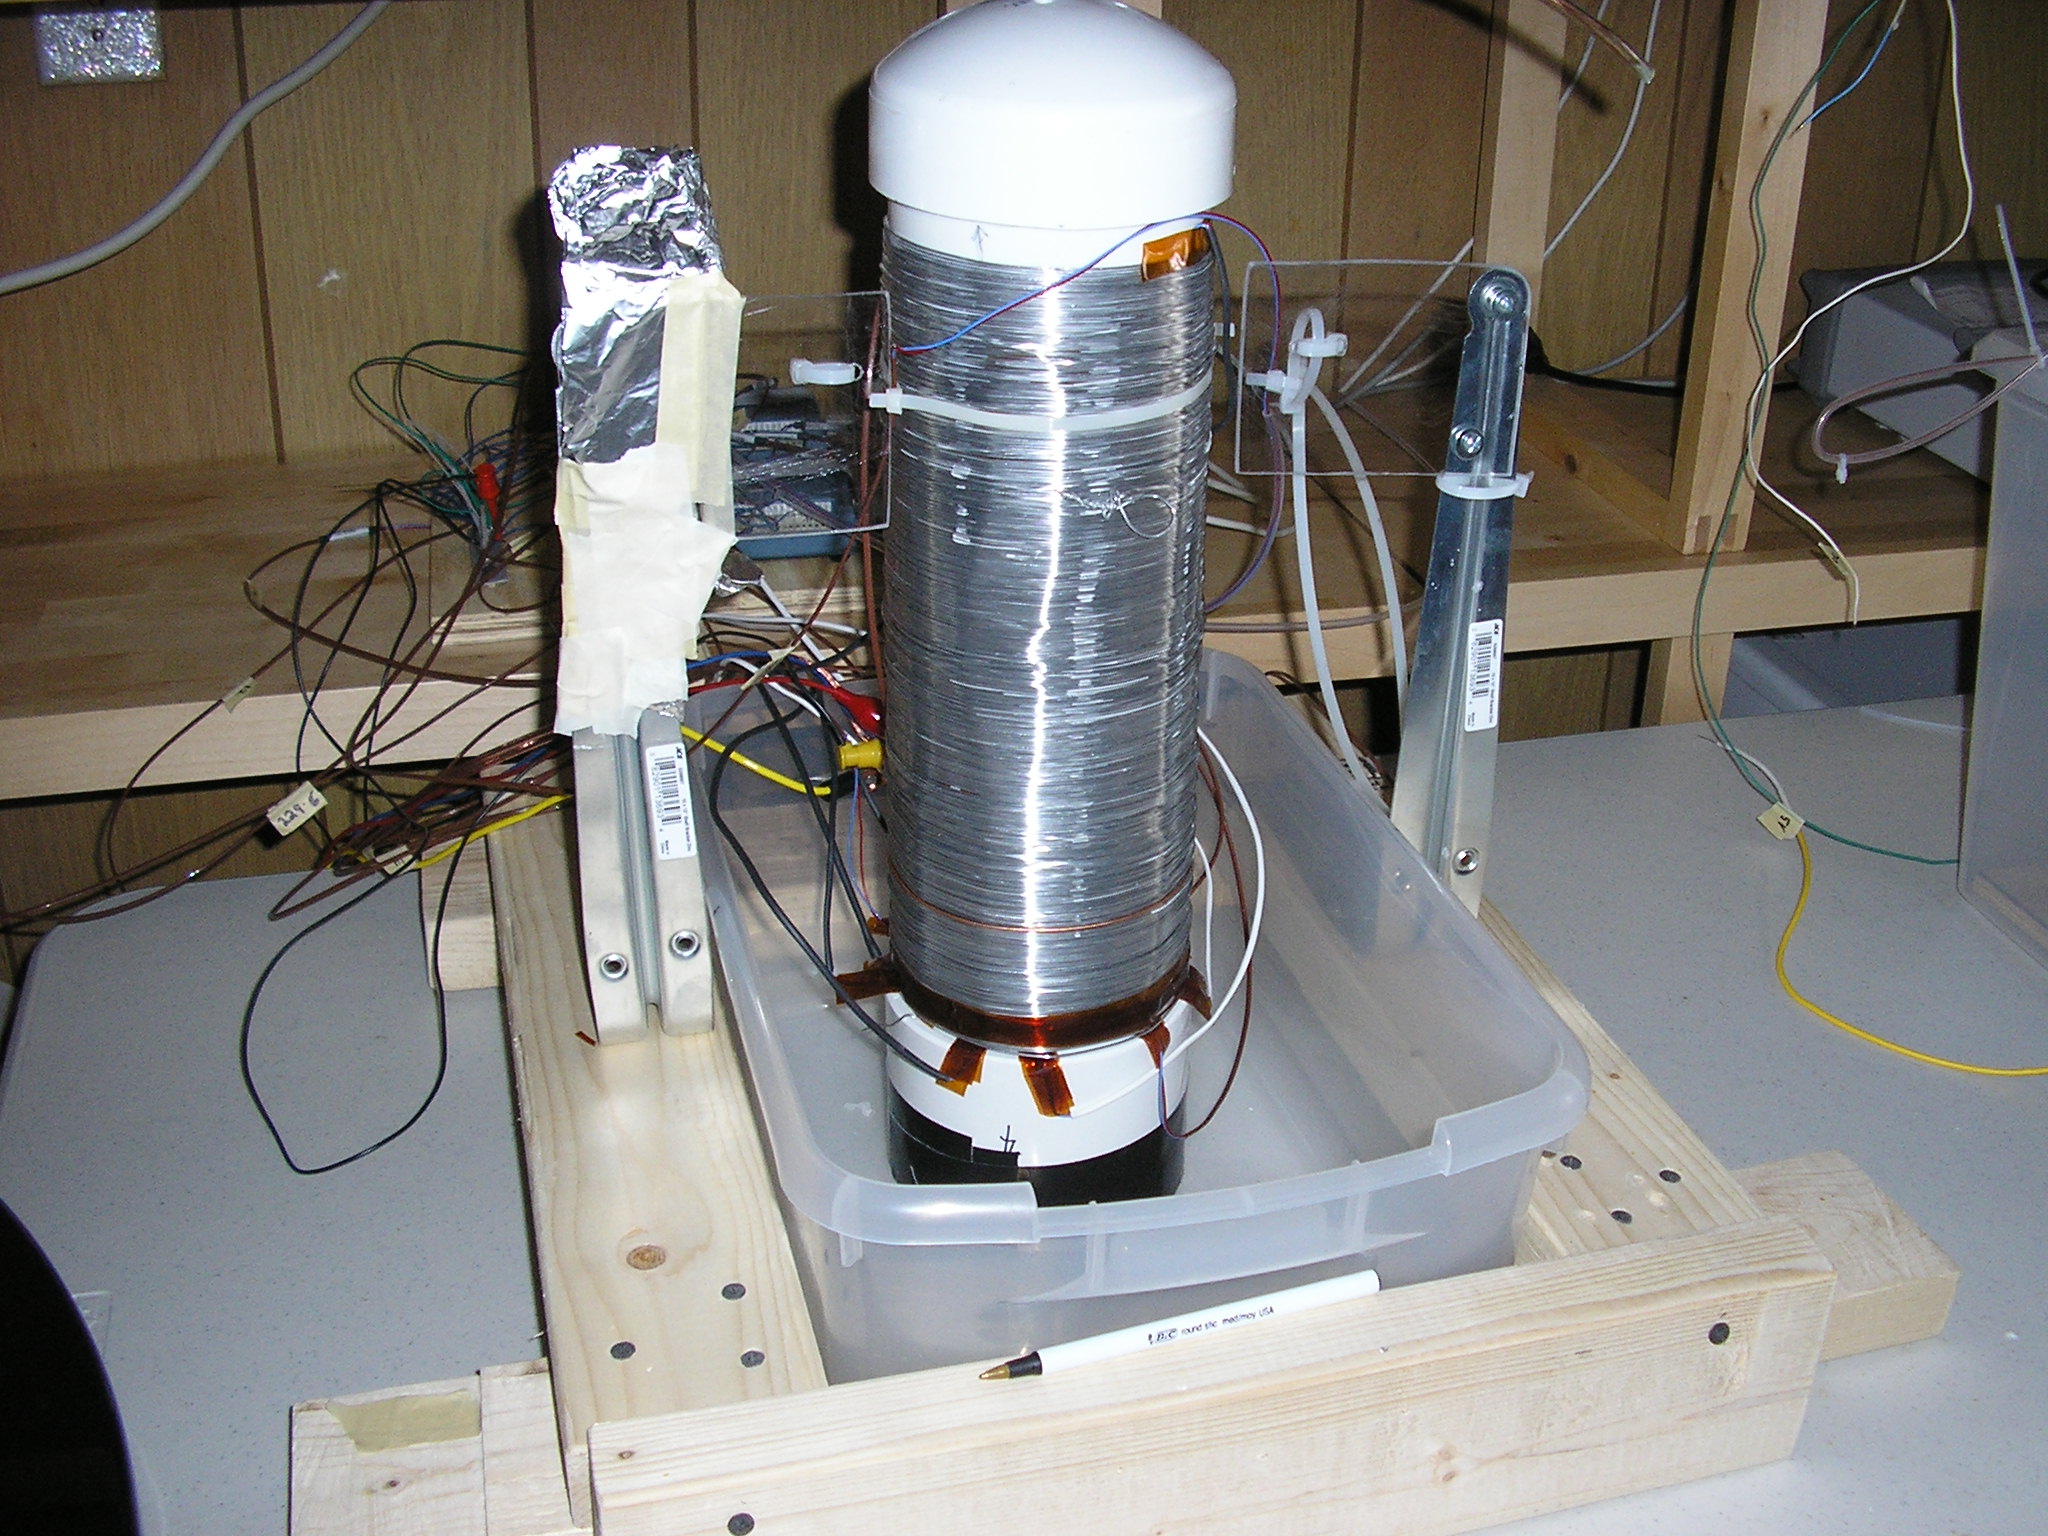
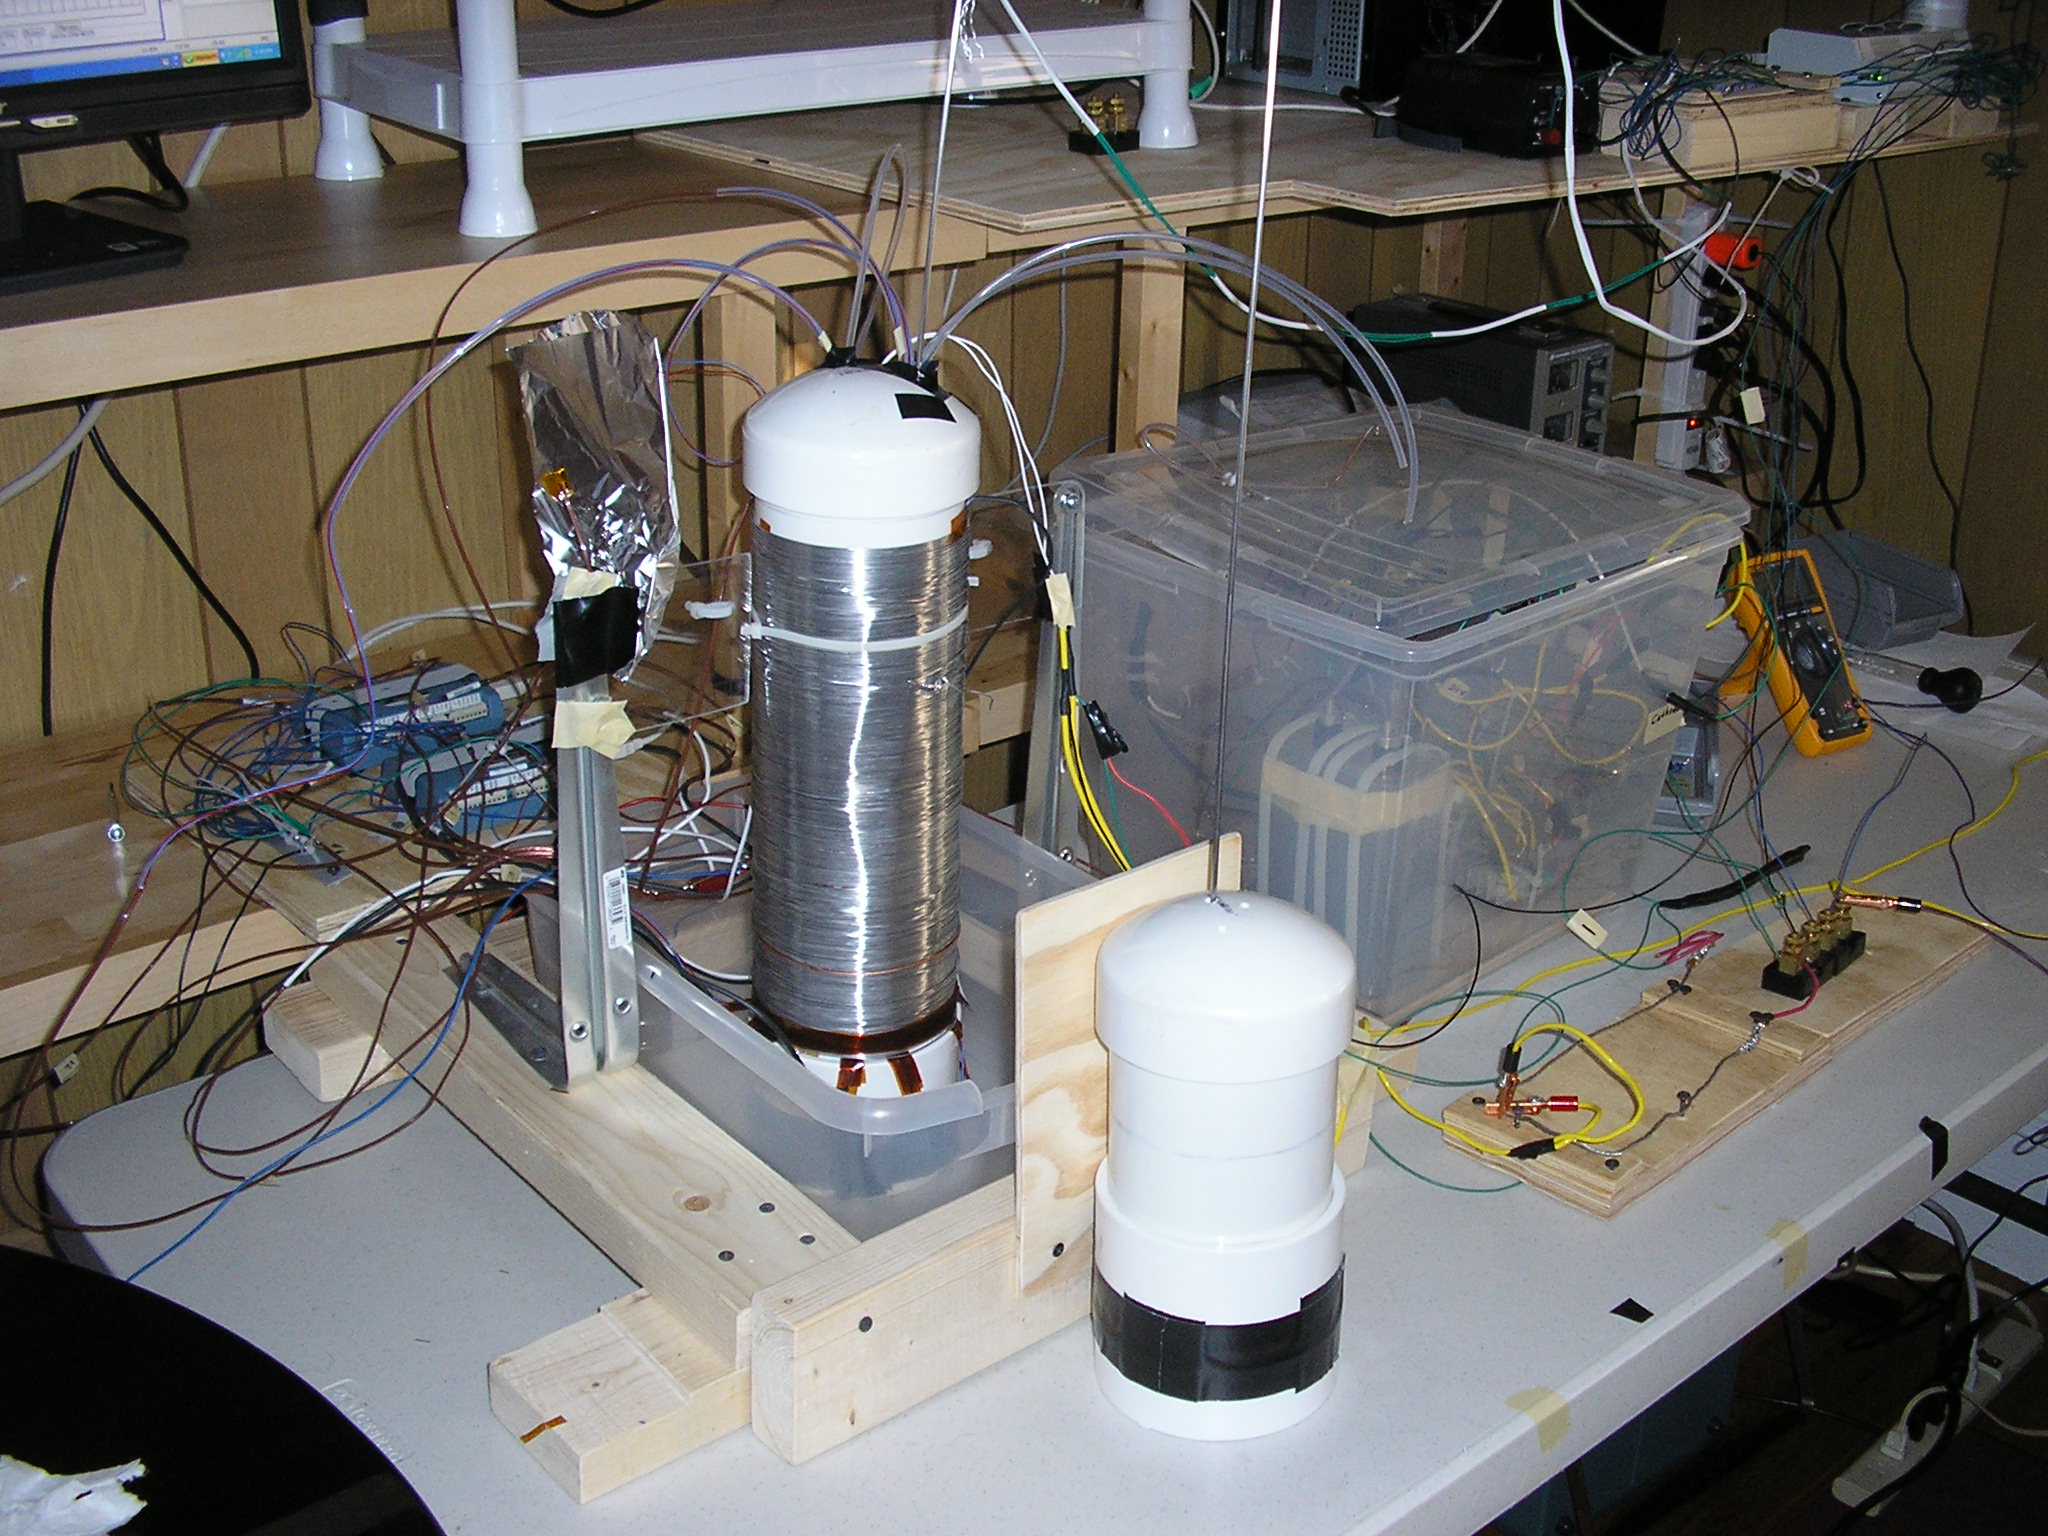
| Arata: Palladium - Zirconium Experiment, 2009 I'm helping a friend in his attempt to replicate the Arata / Zhang experiment that involved Palladium / Zirconium nano-powders and deuterium gas. Arata saw anomalous temperatures in the nano-powders. Here are some links related to that experiment done by Arata. http://www.rexresearch.com/arata/arata.htm Here is a critique of Arata's helium and heat measurements done by Storms and Rothwell: http://www.lenr-canr.org/acrobat/RothwellJreportonar.pdf This experiment being done by my friend is currently ongoing. Here are photos of that setup:
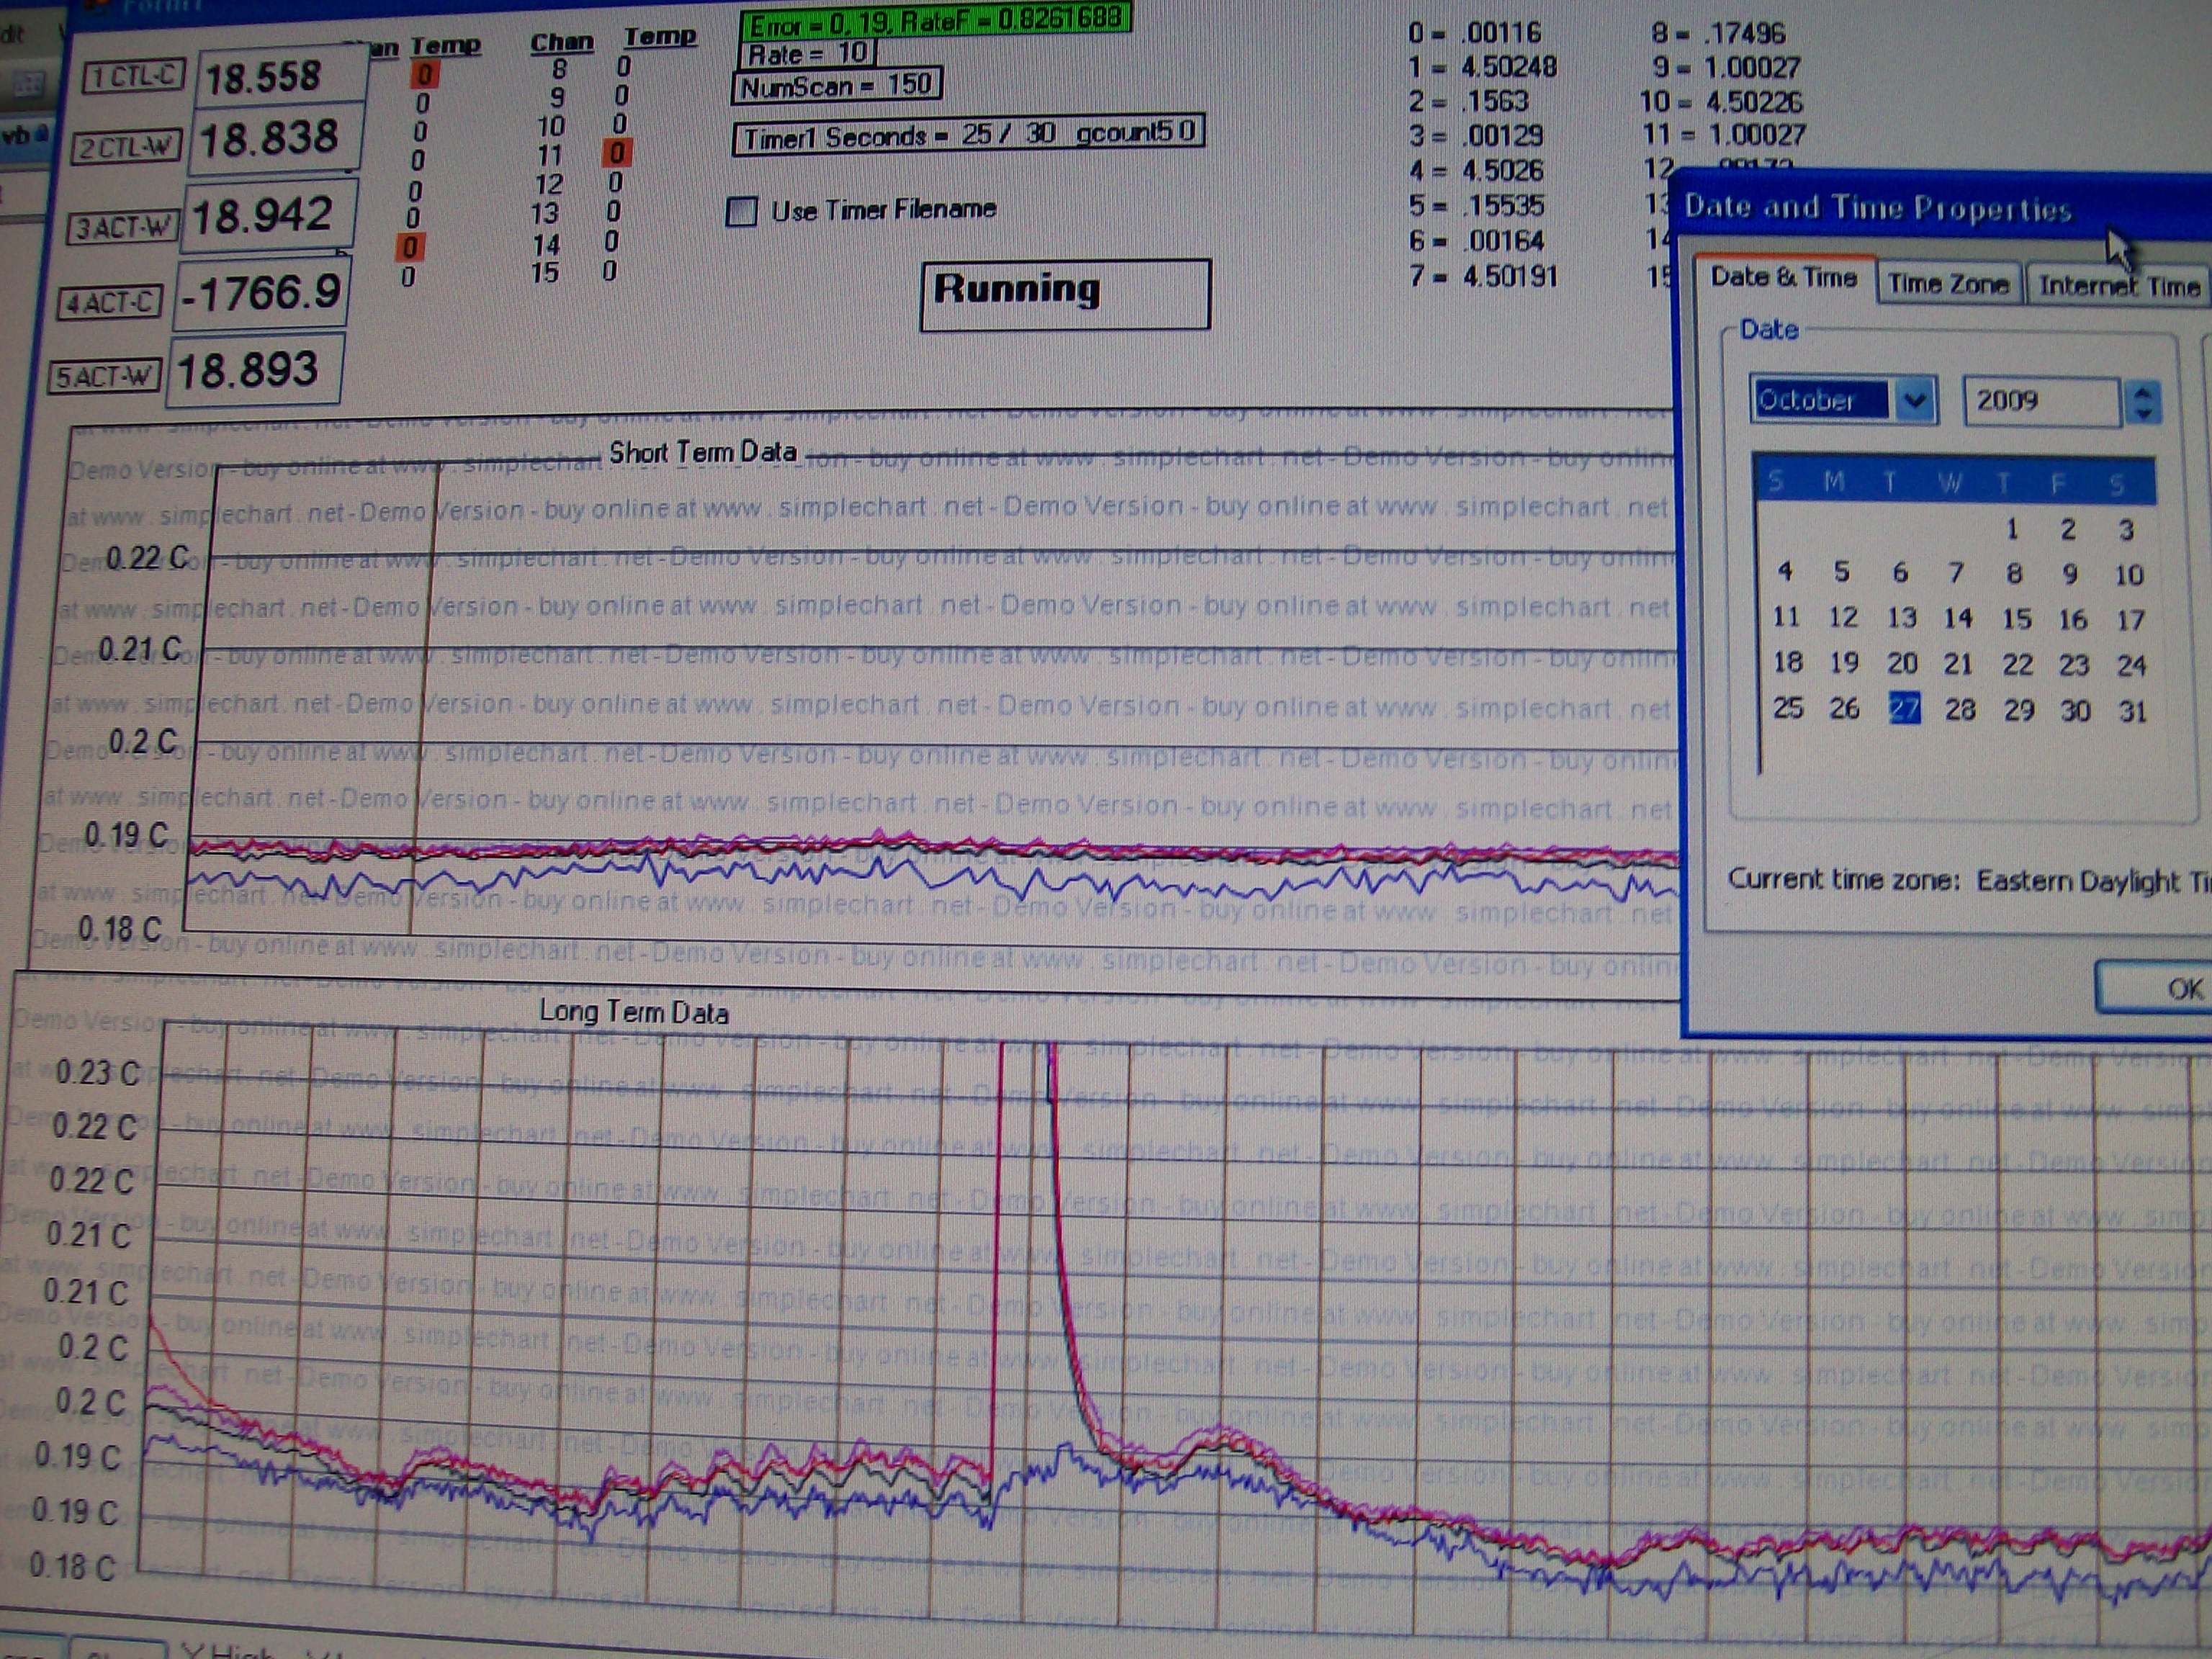
In the graph of temperature versus time shown in the above photo, it incorrectly lists the temperature in Celsius with a 10X error factor. For example, it should read 18 through 23 degrees C on the Y axis, not .18 through .23 degrees C. This was due to a software glitch in the graphing software that I bought but this does not affect the data that was collected. Results This experiment is still ongoing.
|
|||
| High Voltage, High Frequency Experiment, 2008 Summary This experimental work ended in early 2008 before testing was completed though I could restart it if funding became available. This experiment involved high voltage electrolysis (330 Volts chopped DC) using a small thin tungsten wire cathode in a Potassium Hydroxide / Water solution (KOH). The anode was 5 feet of platinum wire and 5 feet of gold wire wound up in a coil. Calibration was done with resistors. "Power Out" measurements were based on thermocouples on the exterior of the vessel along with calibration curves. "Power In" measurements are based on completely discharging a lithium ion battery and knowing (beforehand) the energy stored in the battery. The input power was typically in the 100 watt range. Vessel The vessel consists of a 15 inch tall, 4.5 inch Diameter PVC pipe wrapped with multiple turns of .040 inch diameter aluminum wire. It was filled with distilled water and Potassium Hhydroxide. The purpose of the Aluminum wire wrapped around the exterior of the PVC pipe is so that the device has a uniform temperature around the circumfrence and the emissivity is constant over the entire surface. This improves the accuracy of the thermocouple measurements since the thermocouples are underneath the aluminum wire (between the aluminum wire and the PVC outer diameter). This surface covered with Aluminum wire emits heat to the room through conduction, convection and radiation. The plastic tub that it sits in is never filled with water. The control cell is the short white PVC pipe in the foreground and never has power applied to it. It is used to establish an average room temperature.
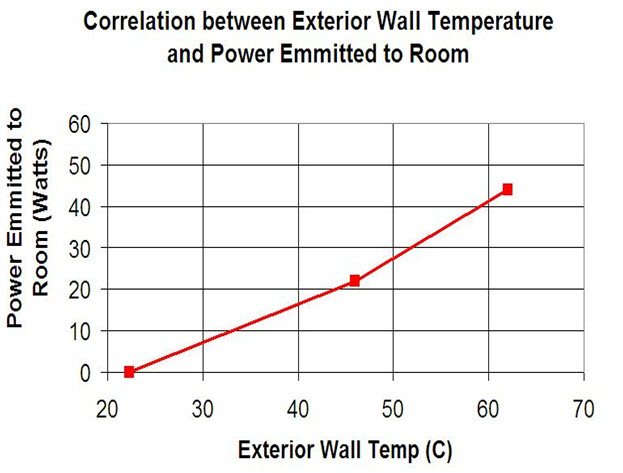
Calibration The equation for conservation of energy for the entire vessel is: Energy Stored = Energy Generated + Energy In - Energy Out (Equation 1) also Energy Stored = Mass * (Specific Heat Capacity) * (Change in Temperature) (Equation 2) where: Mass = mass of the vessel, KOH electrolyte and aluminum wire (all measured as one value). Specific Heat Capacity = specific heat capacity of the vessel, aluminum wire and the potassium hydroxide electrolyte and is measured as one value through data correlations. Change in Temperature = average temperature as measured by the 12 thermocouples on the exterior of the vessel. Determining Energy Out (and similarly Power Out): A graph of exterior wall temperature versus "Power In" (and similarly the "Power out" because it is at steady state) was determined using a resistive heater inside the vessel. Power levels used were 0 watts, 21 watts and 44 watts. The resulting graph is:
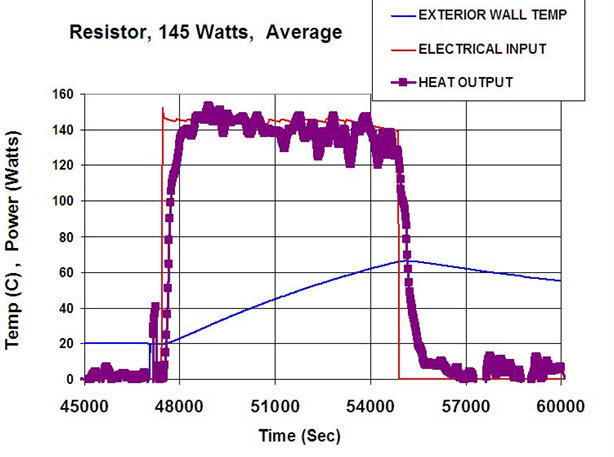
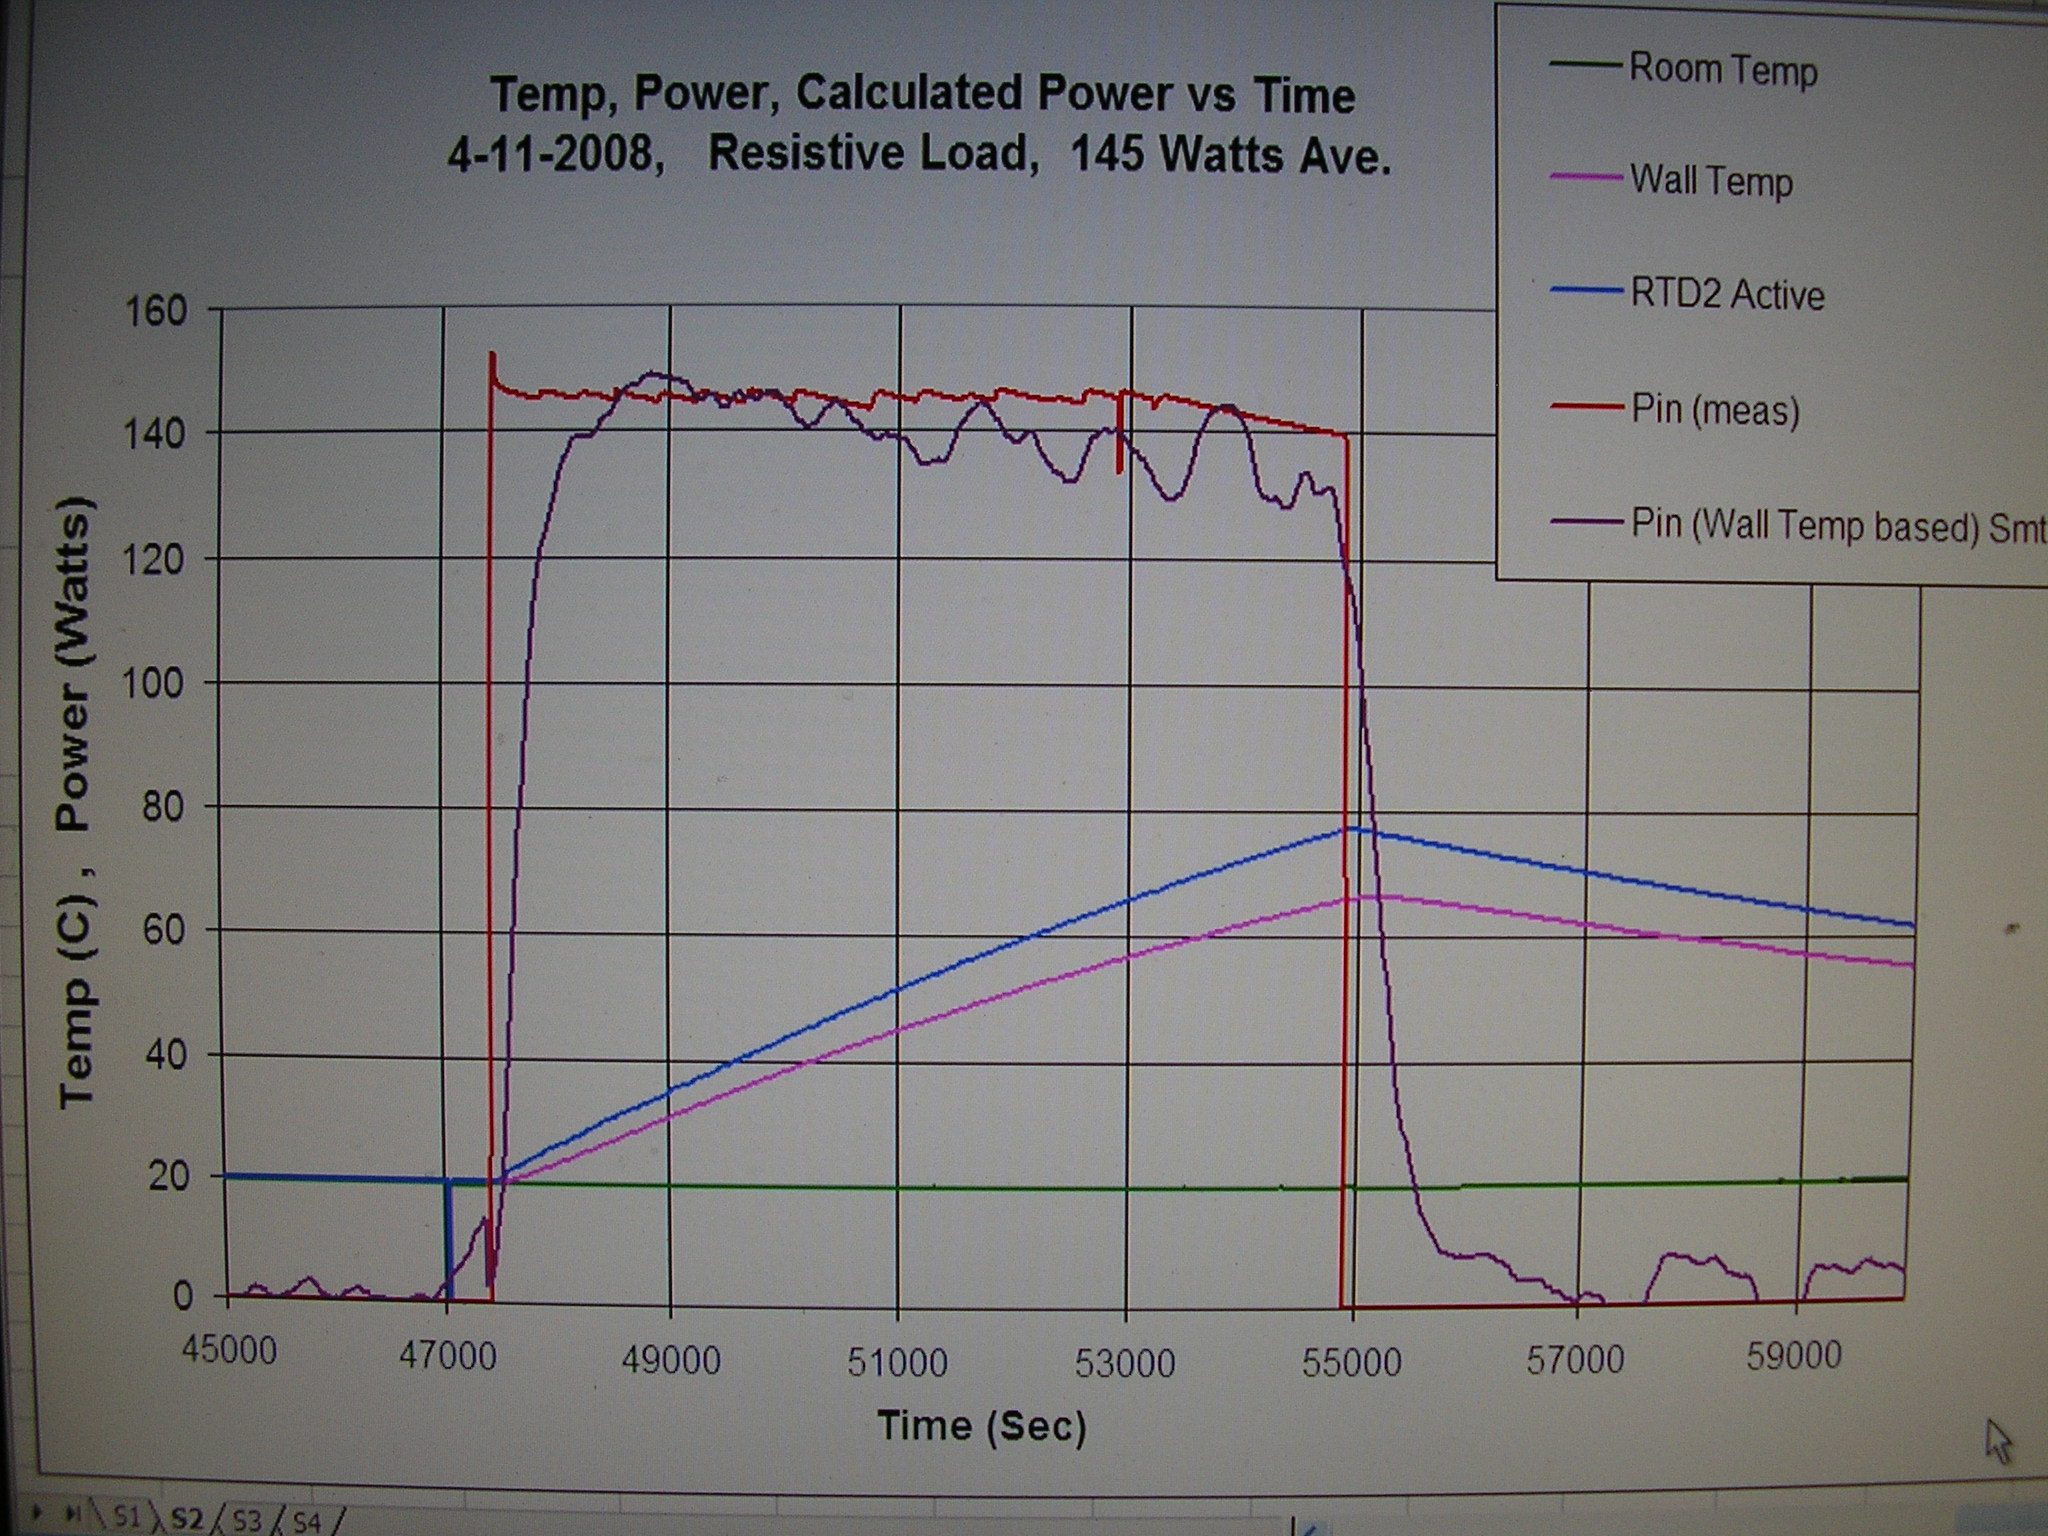
Determining Specific Heat Capacity: Setting Equation 1 equal to Equation 2 and knowing that Energy Generated equals 0 results in the following: Mass x (Specific Heat Capacity) x (Change in Temperature) = Energy In - Energy Out (Equation 3) Using a resistive heater inside the vessel and and inputting a square wave shaped heat pulse (i.e. a constant power in for 2 hours) allows the specific heat capacity to be determined through graphing the power input and Equation 3 (with collected data) on the same graph and using an iterative trial and error approach. The specific heat capacity in Equation 3 is iteratively chosen until a graph of the power output shows a square wave shape that mimics the square wave shape of the power input. When the curves match (as shown in the left photo below), the correct value has been chosen for the specific heat capacity of the system that includes the vessel, Aluminum wire and electrolyte. Though it should be noted that this value of specific heat capacity is not exactly equal to the weighted mass average of the specific heat capacities of each of the components (electrolyte, plastic and Aluminum) but it takes it takes into account that there is a variation in temperatures of the entire system. Also, the specific heat capacity changes with temperature and should be measured at multiple temperatures (or in other words, multiple power levels, each having the square heat pulse shape) for increased accuracy. The software would then use these values of specific heat capacity during an experiment and select the proper one depending on the exterior wall temperature. The end result is computer software that calculates instantaneous power output of the whole system based on temperature measurements of the exterior wall of the vessel.
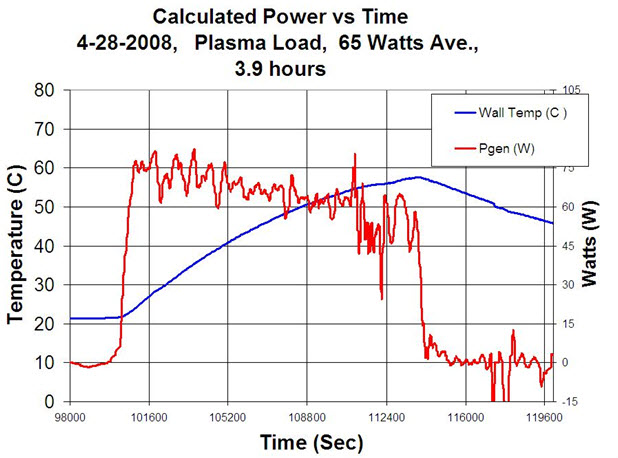
Referring to photo above on the right, a calibration heat pulse of 145 watts for 2.0 hours from a resistor was introduced into the vessel - as shown in the red line labeled "Pin(meas)". The computer program accurately calculated (in real time) the heat pulse as shown in the dark purple line labeled "Pin(Wall Temp based) smth". A camera was used to photograph the computer screen and accounts for the distorted picture. Power Output During High Voltage Electrolysis Power output while the system was producing a plasma inside the vessel was determined based on the thermocouples on the exterior of the vessel and temperature, specific heat capacity of the system and power calibration curves created using resistive heating. Below is graph of the power out while the plasma was operating for 3.9 hours at an average of 65 watts. The plasma was powered on for 2 seconds and off for 5 seconds resulting in the average power of 65 watts.
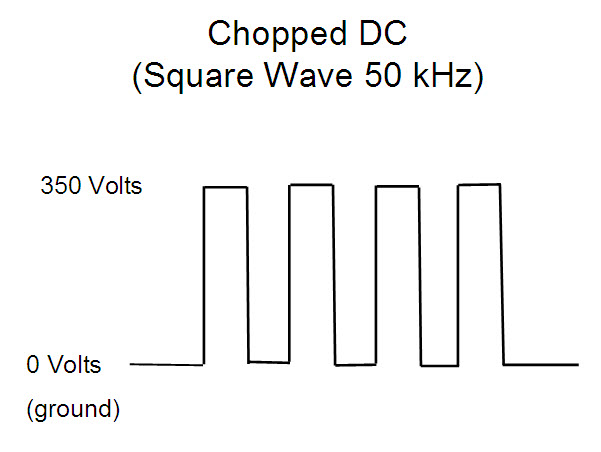
Power Input Input power is 330 V square wave (chopped DC) at 40 kHz (variable up to 100 khz), 1.5 amp and 240 watts. The power is turned on for approximately 5 seconds and then off for approximately 5 seconds on a continuous basis resulting in an average power of 120 watts. Input energy measurements are to be based on the energy stored in a Lithium Ion battery and feeding either all or some portion of that stored energy into the calorimeter. The plasma electrolysis created by the high voltage square wave creates a large amount of high frequency ringing in the current waveform which would be difficult to measure using a high end digital acquisition system. As a result, the energy input is based on calibrations of the power source - the energy stored in a Lithium ion battery. This eliminates errors in trying to measure high frequency current and voltage since there are lots of ringing waveforms. Power Supply The power supply uses an H-Bridge to turn 24 V DC from the
Lithium Ion battery into a 48 V
alternating current square wave. A transformer boosts
the 48 V up to 330 Volts and high voltage Schottky diodes
rectify it creating a 115 Volt DC waveform after it is passed
through a capacitor. The 330 Volt square wave is added to
the 115 Volt DC wave resulting in a 330 Volt square wave
(chopped DC) which is fed to the anode. The power source
is a 24 Volt Lithium Ion battery that is calibrated so that the energy
stored in it is known. The frequency can range between
3000 and 100,000 Hz and is computer controlled. Electrodes Anode (on right in the photo) has approximately 5 feet of Gold wire and 5 feet Platinum wire (both .010 inch diameter) wound in a ring shape of about 1.8 inch diameter. Cathode (on the left) is .040 inch diameter tungsten covered with a ceramic tube (.100 inch OD) so that only 0.10 inch of the tip is exposed. The white cylinder supports are solid Teflon, 2 inch diameter and roughly 1.7" long.
The 2 inch diameter, 9 inch long PVC pipe shown in the photo is used to contain the anode and cathode. It is placed inside the 4 inch diameter, 15 inch long PVC vessel containing the water and Potassium Hydroxide. Gases generated are captured at the top of this 2" diameter vessel and ignited every minute or so using a grounding electrode (not shown) that generates a spark. This grounding electrode that generates the ignition spark is operated manually by pulling on a lever. Results Testing not completed and on hold due to lack of funding and time issues.
|
|||
| Capacitive Discharges Experiment, 2007 Photos:
Video of Capacitor Discharge (click here) Summary In this experiment we discharged the energy stored in large capacitors through a small strip of pure Titanium metal and looked for transmutations in the resulting ash from the explosion. We were trying to replicate work done by a scientist from Russia named Urutskoev. Urutskoev found transmutations and isotope shifts in the Titanium metal debris recovered from the capacitive discharge explosion. http://www.ensmp.fr/aflb/AFLB-297/aflb297m330.pdf http://arxiv.org/ftp/physics/papers/0101/0101089.pdf It would have been too expensive for us to look for isotope shifts in the Titanium from the debris and therefore we did not do that. We did look for new elements such as Copper, Iron, Silicon, Calcium and Aluminum in the debris (ash) but none were found. Equipment Five capacitors were connected in parallel. Each capacitor had the following capacity: 800 uF, 5000 V, 160 lbs, 10,000 J energy. Connecting the five capacitors in parallel resulted in the following: 40,000 uF, 5000 V, 50,000 J energy A high current / high voltage switch was used to connect the capacitors to the load. The switch consisted of spring loaded arm with brass balls as the contacts. Set Up The five capacitors in parallel were charged up to 3000 Volts and discharged through a strip of 99.999% pure Titanium foil. The dimensions of the titanium foil was 0.010" thick, 0.25" wide and 4" long. The foil was surrounded by approximately 500 cc water and glycerine mixture. The capacitive discharge explosion was contained in a large plastic barrel (35 gallon) and the resulting debris consisted of a titanium powder and water slurry. This slurry was dried and sent to a water quality testing laboratory for analysis. Results The debris (ash) from the capacitive discharge was sent to a water quality testing laboratory for analysis and tested for the following elements: Copper, Iron, Silicon, Calcium and Aluminum. No anomalous amounts of these elements or other elements were found.
|
|||
| Proton Conductor Experiment, 1995 In this experiment we tried to reproduce the 1994 claims made by a scientist from Japan named Tadahiko Mizuno. Mizuno claimed that a specially prepared ceramic material ( a proton conductor) made from an oxide of Strontium, Cerium, Niobium and Yttrium produced anomalous heat when exposed to Deuterium gas but no anomalous heat when exposed to Hydrogen gas. In this experiment, the ceramic material (an oxide of Strontium, Cerium, Niobium and Yttrium) having a size of 0.7" diameter and 0.12" thick was coated on each face with Platinum and heated to 350 C. A voltage of between 2 and 30 volts was put across the two Platinum coated faces under vacuum. Next, either Hydrogen or Dueterium gas was introduced at less than 0.1 atmospheric pressure. Results We were unable to reproduce the experimental results claimed by Tadahiko Mizuno. Links http://www.lenr-canr.org/acrobat/MizunoTanalysisof.pdf
|
|||
| Previous Experiments (click here) | Creating Ball Lightning (click here) | Links | |